
Business profile
Business Profile gives you a complete view of a business's history with your organization, all in one place in the Dashboard. When you open a business, you can see the addresses with Google Maps and Street View, NAICS classification, application velocity, market-wide loan inquiries, and associated bank accounts. Everything your underwriting team needs to make a confident lending decision is available in a single view.
TipTo access the same data programmatically, see Business History API.
This page covers the following sections:
Key benefits
| Capability | Description |
|---|---|
| No API required | Everything is available directly in the Ocrolus Dashboard. No integration or technical setup is needed to access business-level data. |
| Location verification without leaving the Dashboard | The Addresses section embeds Google Maps and Street View so you can visually confirm a business operates where it claims to, right from the Overview page. |
| Instant application history | The Historical Applications page lists every Book your organization has submitted for a business in reverse chronological order, with authenticity scores and expandable document detail.ks. |
| Industry override at the business level | If the NAICS classification is incorrect, you can override it directly from the Dashboard. The override applies across your entire organization and persists across future submissions. |
| Expandable loan inquiry timeline | Loan inquiries are grouped by month and each month expands to show individual inquiry timestamps, giving you a granular view of market-wide borrowing activity over time. |
| Document preview without switching tabs | Select any document within a Book to preview it in the right-side panel, without opening a new tab or leaving the Business Profile. |
When to use it
Use Business Profile when you are working in the Ocrolus Dashboard and need to:
- Review a repeat borrower: A merchant has submitted more than one application and you need a single view of their full history with your organization before making a decision.
- Verify a business location: You want to confirm a business operates where it claims to using Google Maps and Street View, without leaving the Dashboard.
- Spot stacking risk quickly: The Application velocity widget gives you an at-a-glance count of applications across six time windows, so you can identify unusual borrowing patterns without pulling a report.
- Check market-wide loan activity: You need to see how many times a business has appeared in loan applications across the Ocrolus network, not just your organization.
- Audit a borrower's document history: You need to find a specific document or statement across multiple Books without opening each one individually.
- Override an incorrect industry classification: The NAICS code on file for a business is wrong and you need to correct it before it affects downstream decisioning.
Navigate to Business Profile
The Ocrolus Dashboard offers two views: the Books view (the default) and the Businesses view (Business Profile).
Step 1 — Switch to the Businesses view
Log in to the Ocrolus Dashboard. In the left navigation bar, click Businesses. The Dashboard switches from the application-level Book list to the business-level view.
Step 2 — Find and select a business
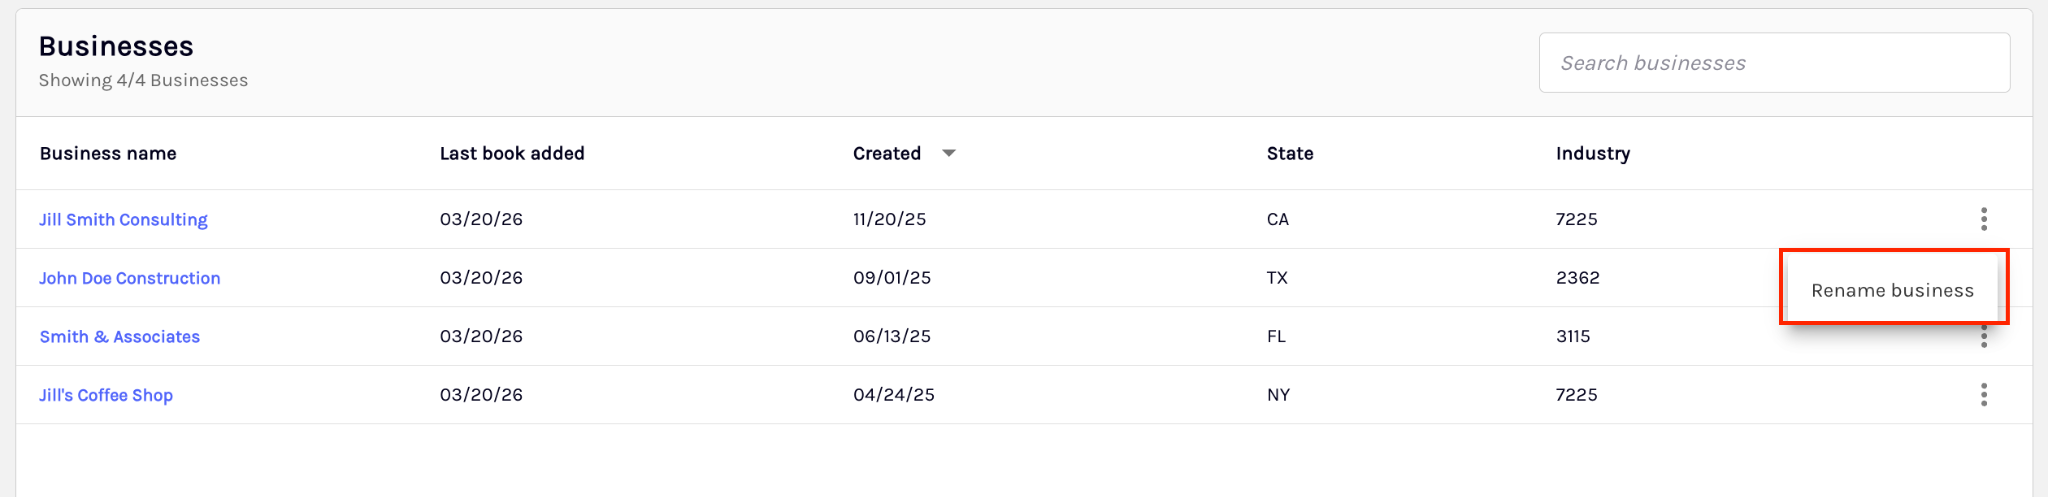
The Businesses page lists every business your organization has submitted to Ocrolus. Each row shows the business name, date of the most recent Book, date the business was first created in Ocrolus, the business's state, and the NAICS industry classification.
To find a specific business, use the search bar at the top right. To sort the list, click the Created column header. Click any business name to open its Business Overview page.
Step 3 — Rename a business (optional)
If a business's name needs correction, click the kebab menu (three dots) on the right side of the business's row and select Rename business. Enter the corrected name and click Submit. The updated name applies across all Books associated with that business in your organization.
Business Overview page
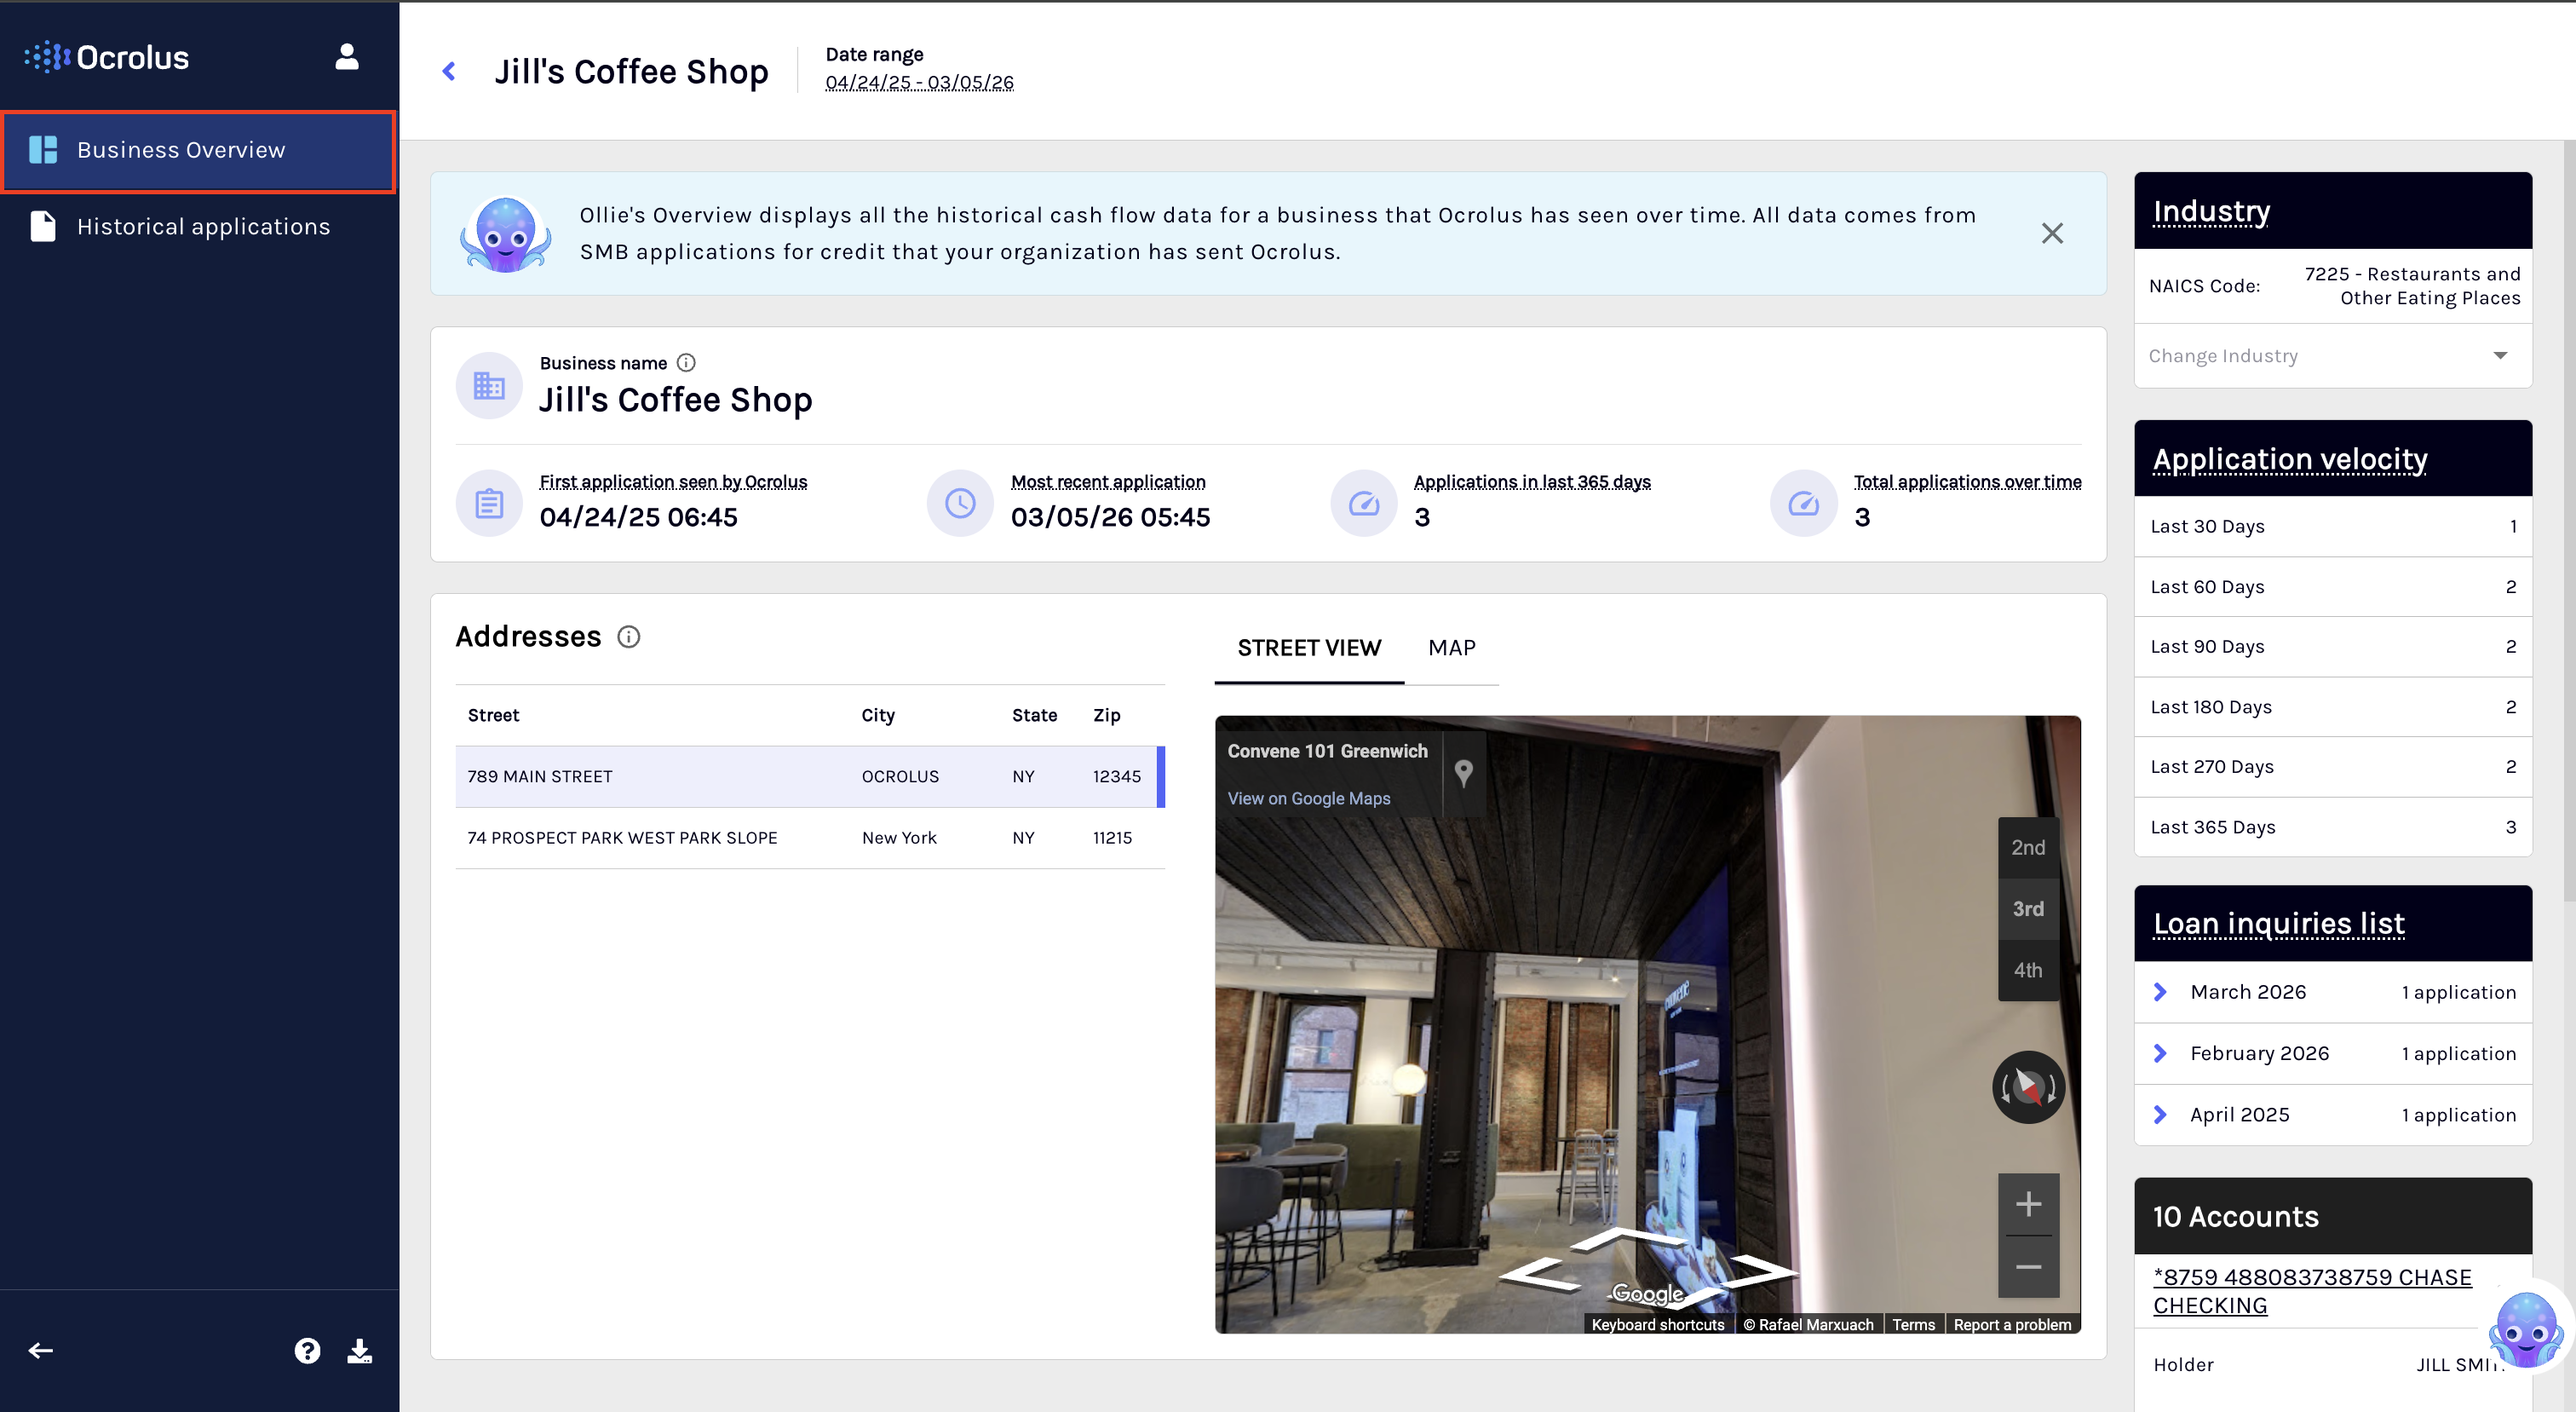
The Business Overview page gives you a consolidated view of a business's identity, location, industry, and borrowing activity. Use it as your starting point when reviewing a borrower in the Dashboard. This consolidated view shows the business name and date range at the top, followed by a summary card showing first and most recent application dates, application count over the last 365 days, and total applications over time.
The Addresses section lists all addresses on file, with Map and Street View tabs for each location. The Industry section shows the NAICS code and description, with an option to override the classification across your entire organization.
The Application velocity section shows application counts across six time windows. The Loan inquiries section shows market-wide loan activity grouped by month, with individual timestamps on expand. The Bank accounts section lists all accounts pulled from statements uploaded across all applications.
Business info card
Shows the business name (editable via the pencil icon), the date Ocrolus first received an application for this business, the most recent application date, the number of applications in the last 365 days, and the total application count over time.
Addresses
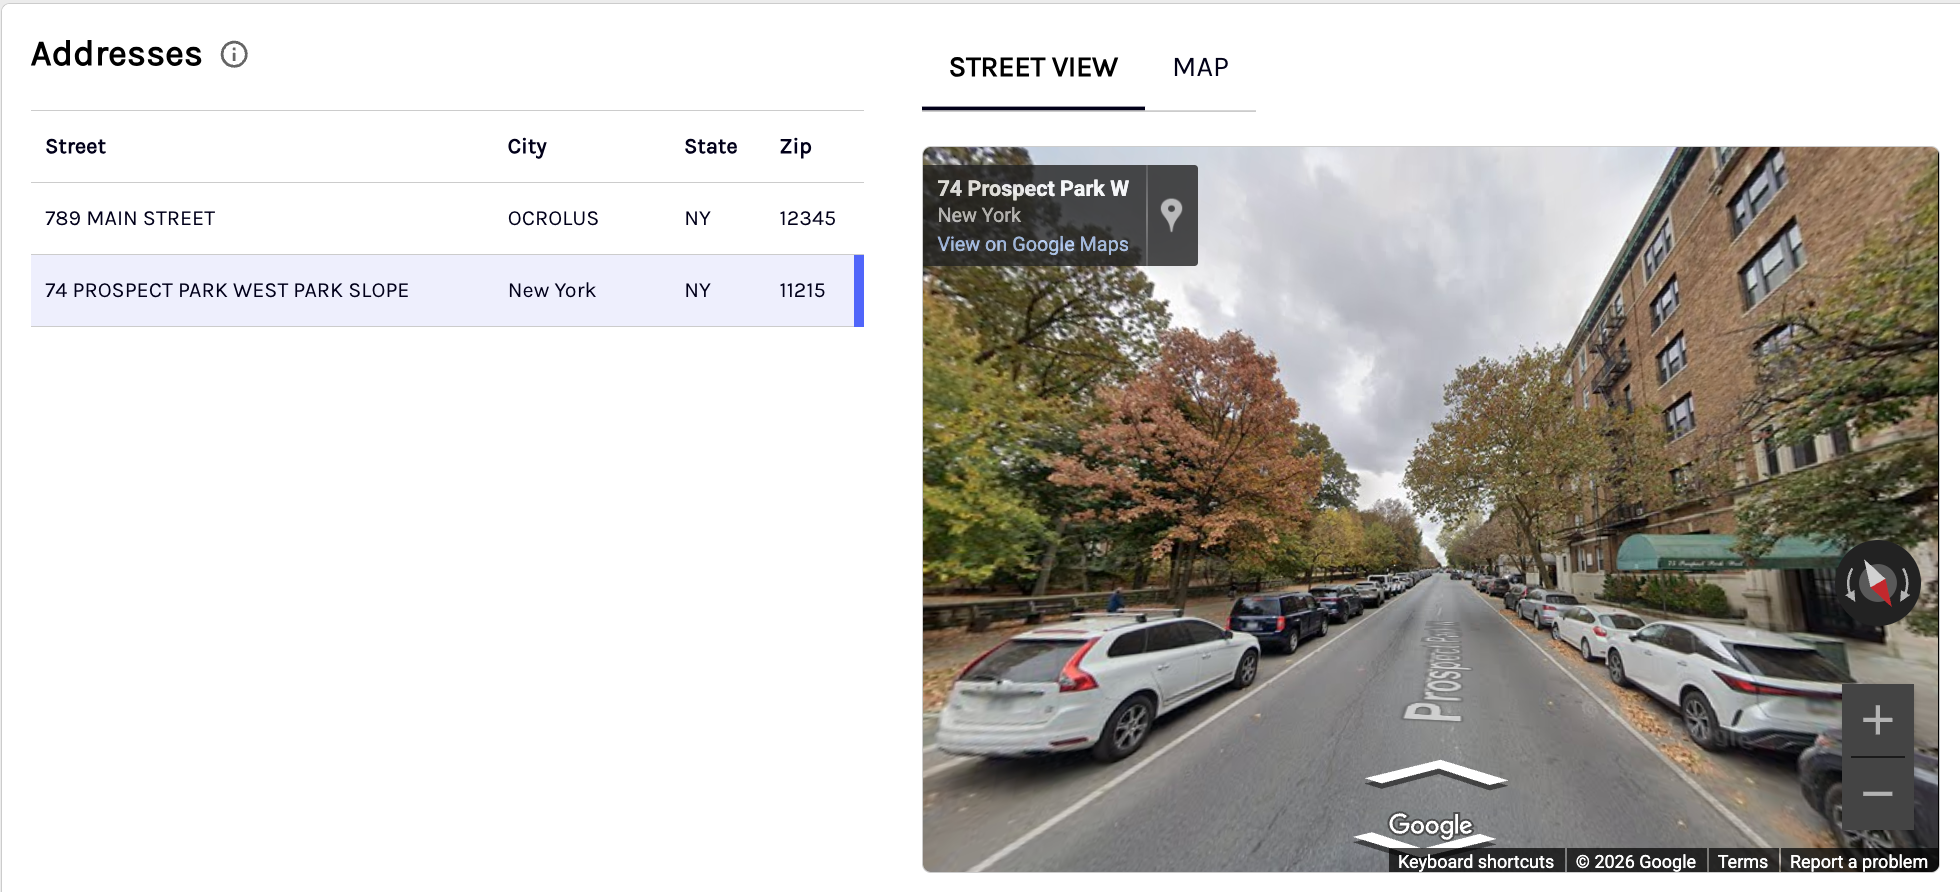
Shows all addresses Ocrolus has on file for this business. Click any address row to open its Google Maps location and Street View. Both views are interactive, click either one to open the full Google Maps view in a new browser tab.
If no address is found on file, the section displays No Address found for this business. If Street View imagery is unavailable, the Street View panel displays Street View not available message but the Map tab still works.
Industry
Shows the business's NAICS code and industry description. If the classification is incorrect, select Change industry to override it. Industry overrides apply at the business level across your entire organization.
Application velocity
Shows the number of applications received for this business across six time windows: last 30, 60, 90, 180, 270, and 365 days. Use this to identify spikes in application frequency that may warrant further review.
Loan inquiries
Shows how many times this business has appeared in loan applications across the market, not just within your organization. The data is grouped by month and each month can be expanded to show individual inquiry timestamps. This is the same cross-organization data available through the Business History API.
Bank accounts
Shows the bank accounts associated with this business, fetched from bank statements uploaded across all applications. Includes the account name, holder, date range, and address.
Historical applications
Click Historical applications in the left navigation to view all Books your organization has submitted for this business, with the most recent first. This page lists every Book submitted for this business. Each Book shows its name, status, uploaded date, and authenticity score. Select the accordion to expand the documents within a Book, or select the Book name to open it in the application view in a new tab.
To open a Book in the full application-level view, click its name. The Book opens in a new browser tab, preserving your place in the Business Profile.
Accounts page
The Accounts page summarizes every bank account associated with the business across all submitted Books, followed by cash flow charts and a business-level summary panel.
Accounts table
Each account appears as its own table, labeled with the account identifier and a badge showing how many statement periods it covers, such as 7 periods. Each row represents a sub-period, with a totals row at the end of the table.
| Column | Description |
|---|---|
| Starting balance | Account balance at the start of the period. |
| Ending balance | Account balance at the end of the period. |
| Avg. daily balance | Average daily balance across the period. |
| Avg. txn size | Average transaction amount in the period. |
| -ve balance days | Number of days the account held a negative balance. |
| Max. deposit | Largest single deposit in the period. |
| Max. withdrawal | Largest single withdrawal in the period. |
| Avg. deposit | Average deposit amount in the period. |
| Total deposits | Sum of deposits in the period. |
| Total withdrawals | Sum of withdrawals in the period. |
Expand any account to see its period-by-period breakdown. Where no statements cover part of the date range, the table shows a message such as No data available from Jun – Dec 2023 in place of values.
Revenue vs expenses
The Revenue vs expense chart compares deposits (revenue) against withdrawals (expense) across Daily, Weekly and Monthly views, with a download option. Revenue bars are shown in green where is expense bars are shown red.
In the Daily view, each bar represents one calendar day. Periods with no statement data appear as a shaded No data available band.
Below the chart, a summary table shows monthly Revenue, Expense, Deposits and Withdrawals, each with a transaction count. Months with no data show NA.
Balance history
The Balance history chart tracks account balance over time, with the same Daily, Weekly and Monthly views and download option as Revenue vs expense. You can view one account or multiple accounts together.
When multiple accounts are selected, a period is marked No Data only if no data is available across all accounts for that period.
Business summary panel
The right side panel summarizes the business at a glance:
- Industry (4-digit NAICS): the business's NAICS code and description. Select Change industry to override the classification, or Reset to return to the default. Overrides apply across your organization.
- Cashflow summary: average and total figures for revenue and expense, average daily balance, average loan payments, debt coverage ratio, total NSF count and amount, and total overdrafts.
- Top revenue counterparties: the largest sources of incoming funds, by amount.
- Top expense counterparties: the largest destinations of outgoing funds, by amount.
Transactions page
The transaction page lists every deduplicated, enriched transaction across all of the business's submitted Books, including Books that are private to your organization, in one searchable table. The page header shows the total transaction count.
Transaction table
| Description | |
|---|---|
| Star | Flag a transaction for follow-up. |
| Date | Date the transaction occurred at the bank. |
| Description | Raw transaction description from the statement. |
| Amount | Transaction amount. Credits are positive, debits are negative. |
| Revenue | Toggle indicating whether the deposit is counted as revenue. |
| Tags | Enriched classification tags, shown as colored badges. |
| Account | The bank account the transaction belongs to. |
| Counterparty | The standardized counterparty for the transaction. |
| Comment | Notes you add to the transaction. |
Search, filter and edit
Use the controls above the table to search by description or filter by item, tag, and account. Select one or more rows to apply bulk actions.
Transactions are deduplicated within each bank account, when statement periods overlap across Books, the most recent data source wins and each transaction appears once. Tags reflect your organization's latest customizations and update automatically.
Related resources
Overview of the Businesses experience including capabilities, prerequisites, and when to use it.
Programmatic access to the same business-level data.
Book-level cash flow data and reporting in the Dashboard.
Fraud and tampering signals shown alongside each Book in Historical Applications.
Updated 3 months ago