
Book overview
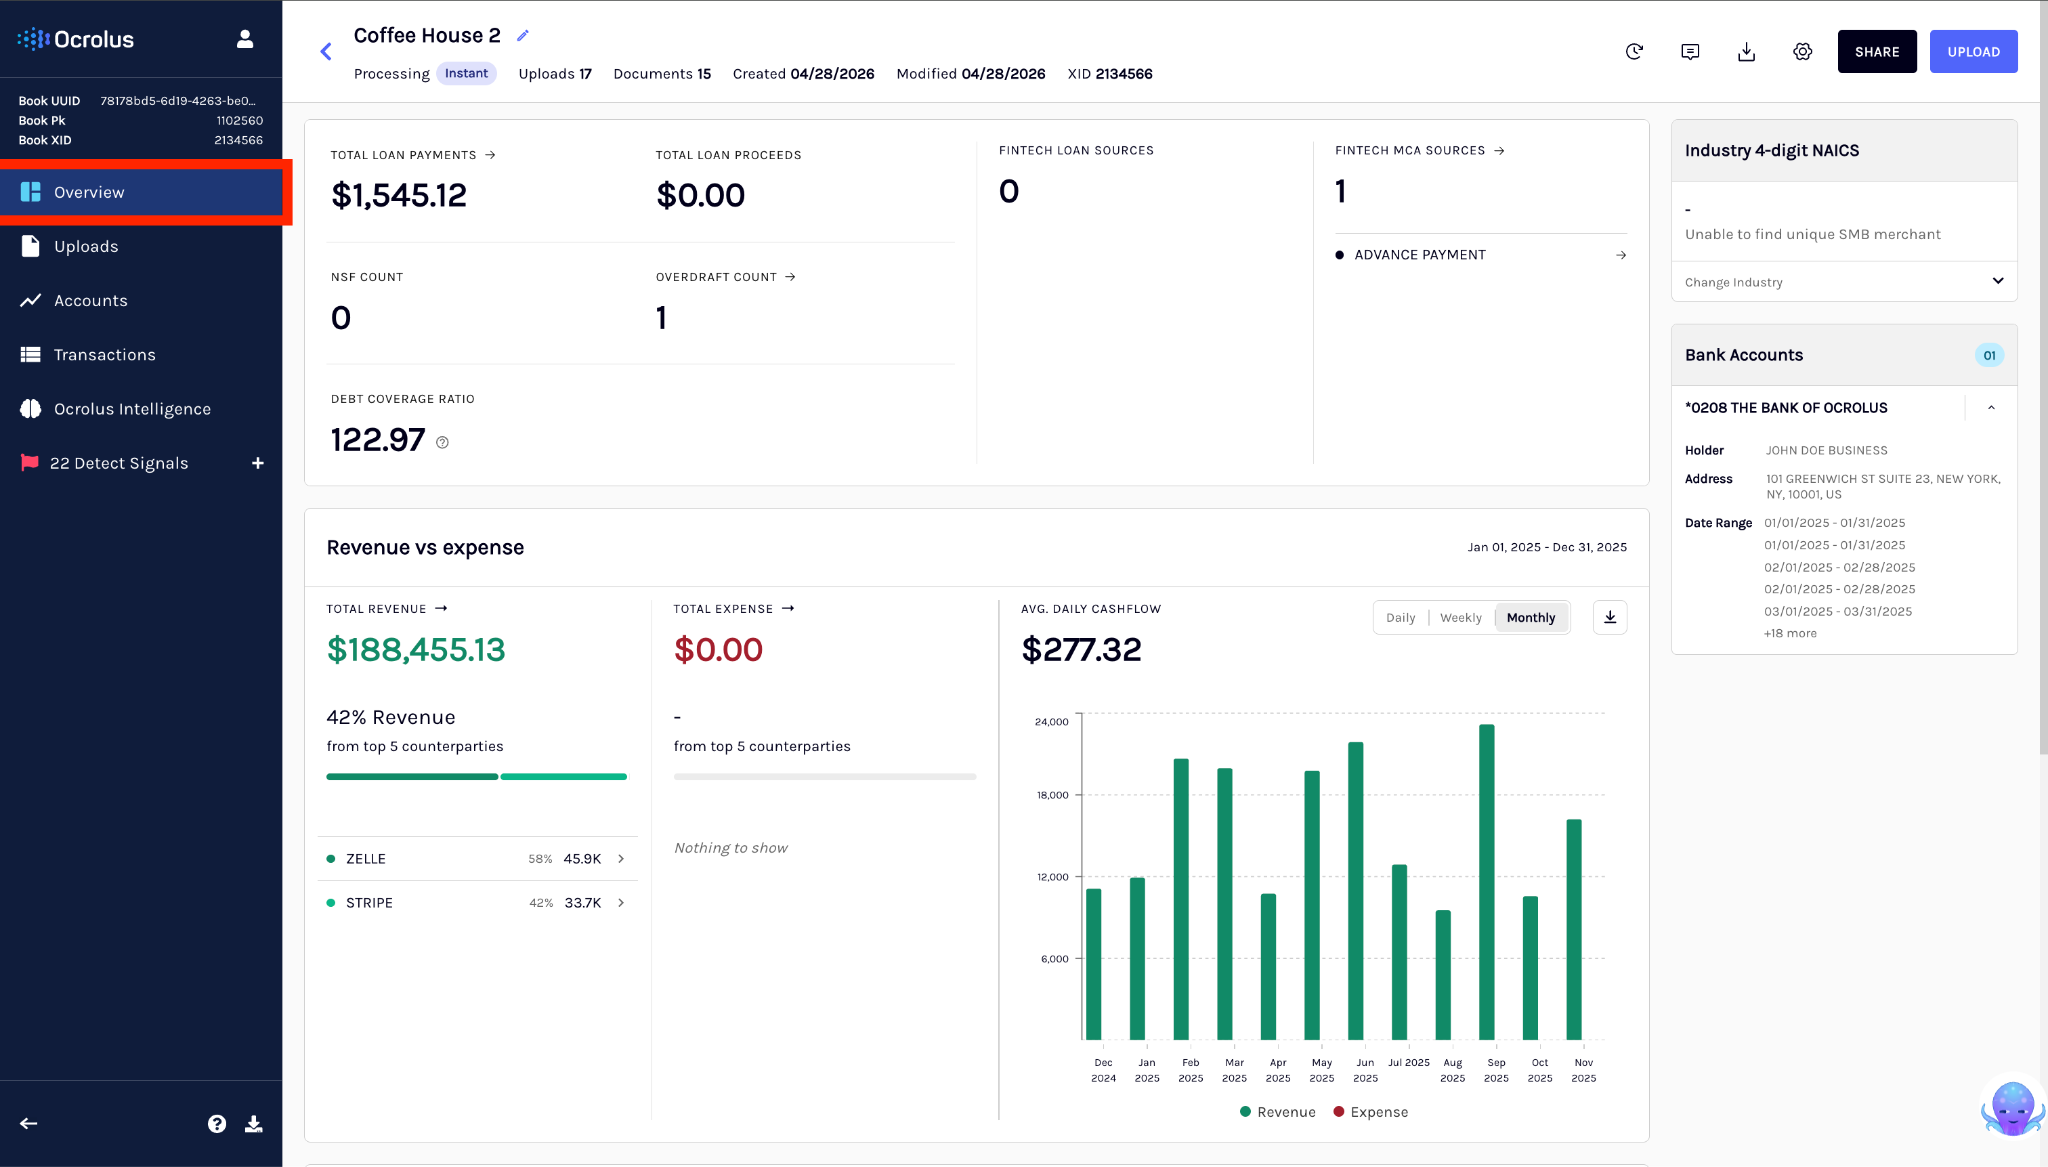
Book Overview is the first page you see when you open a Book. It summarizes the borrower's financial and operational profile in one view such as key metrics, industry classification, and banking footprint.
You get the borrower's top-level indicators without extra navigation. Any metric can be expanded to view the transactions or accounts behind it in a single click.
Access Book Overview as the default landing page when you open a Book, or from the left-hand navigation sidebar. From the top right, you can add a document, review the activity log, or leave a comment.
In this section
The Book Overview page opens with a header that confirms the Book you are reviewing and provides access to Book-level actions. Below it, key cash flow and loan metrics give you an at-a-glance view of lending risk, covering loan proceeds and payments, NSF and overdraft counts, and debt coverage ratios. Fintech loan sources surface existing debt obligations, while the revenue and expense section helps you assess revenue concentration risk. An industry classification widget shows the merchant's 4-digit NAICS code for peer group benchmarking, and a bank accounts section lets you verify complete account coverage across the Book. A balance history visualization rounds out the page, helping you spot liquidity dips over the period.
| Section | What it's for | Opens |
|---|---|---|
| Header | Confirm which Book you're reviewing and reach Book-level actions | — |
| Cash flow and loan metrics | Judge lending risk at a glance, loan proceeds and payments, NSF and overdraft counts, debt coverage ratio | Transactions, filtered to the matching tag |
| Fintech loan sources | Identify existing debt before you decide | Accounts; a lender row opens Transactions |
| Revenue and expense | Assess revenue concentration risk | Accounts; a counterparty row opens Transactions |
| Industry (4-digit NAICS) | Confirm the peer group benchmarks compare against | Stays on the page |
| Bank accounts | Verify the Book covers every account | Accounts, filtered to that account |
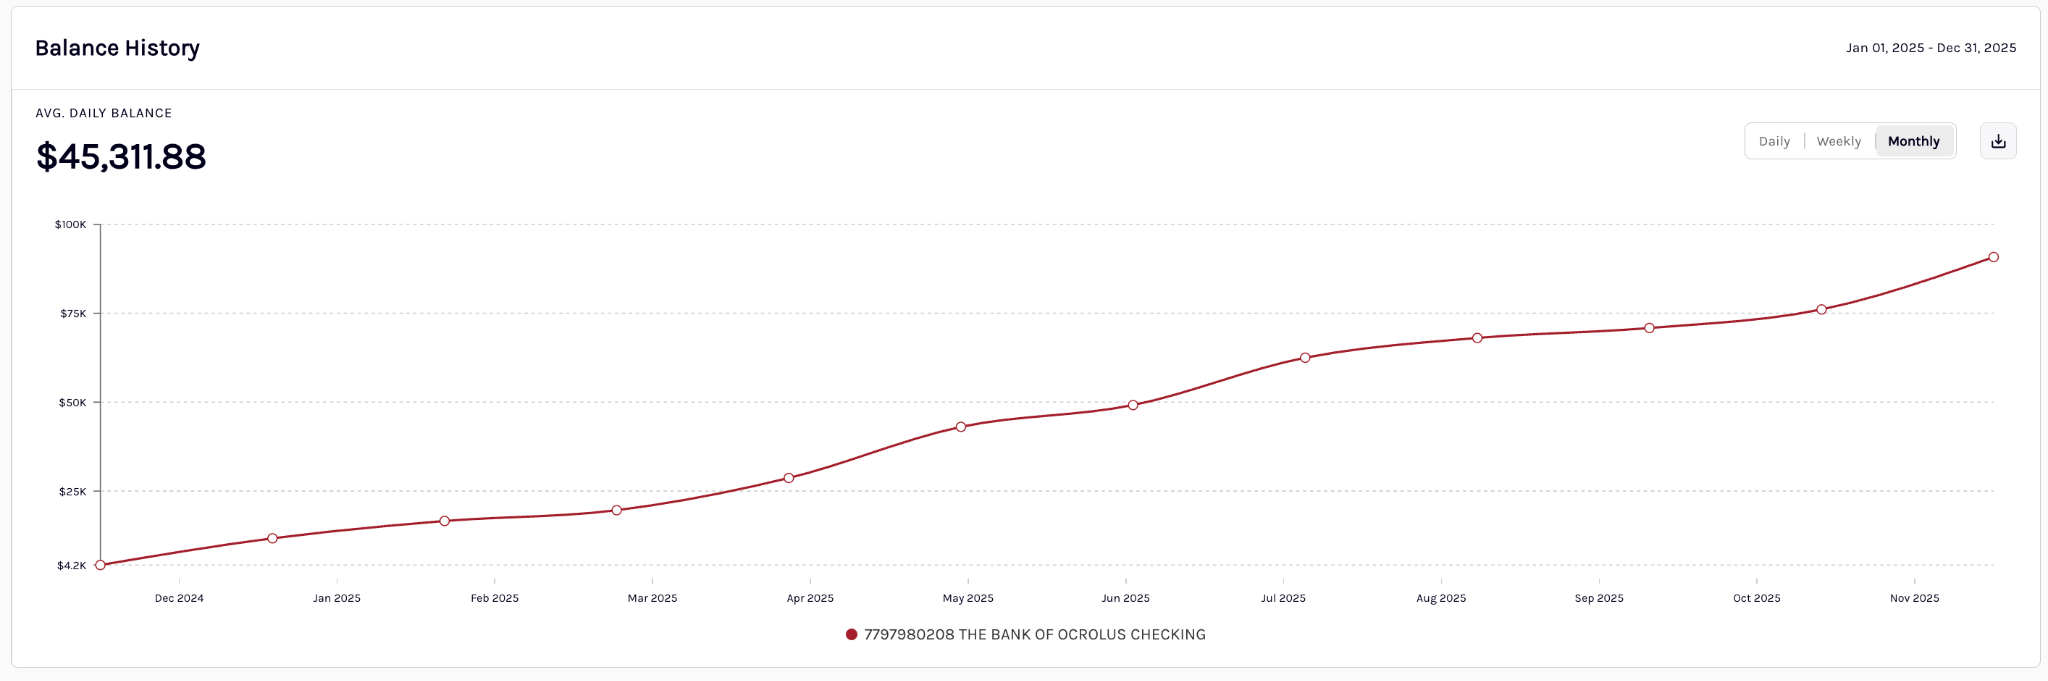
| Balance history | Spot liquidity dips over the period | Stays on the page |
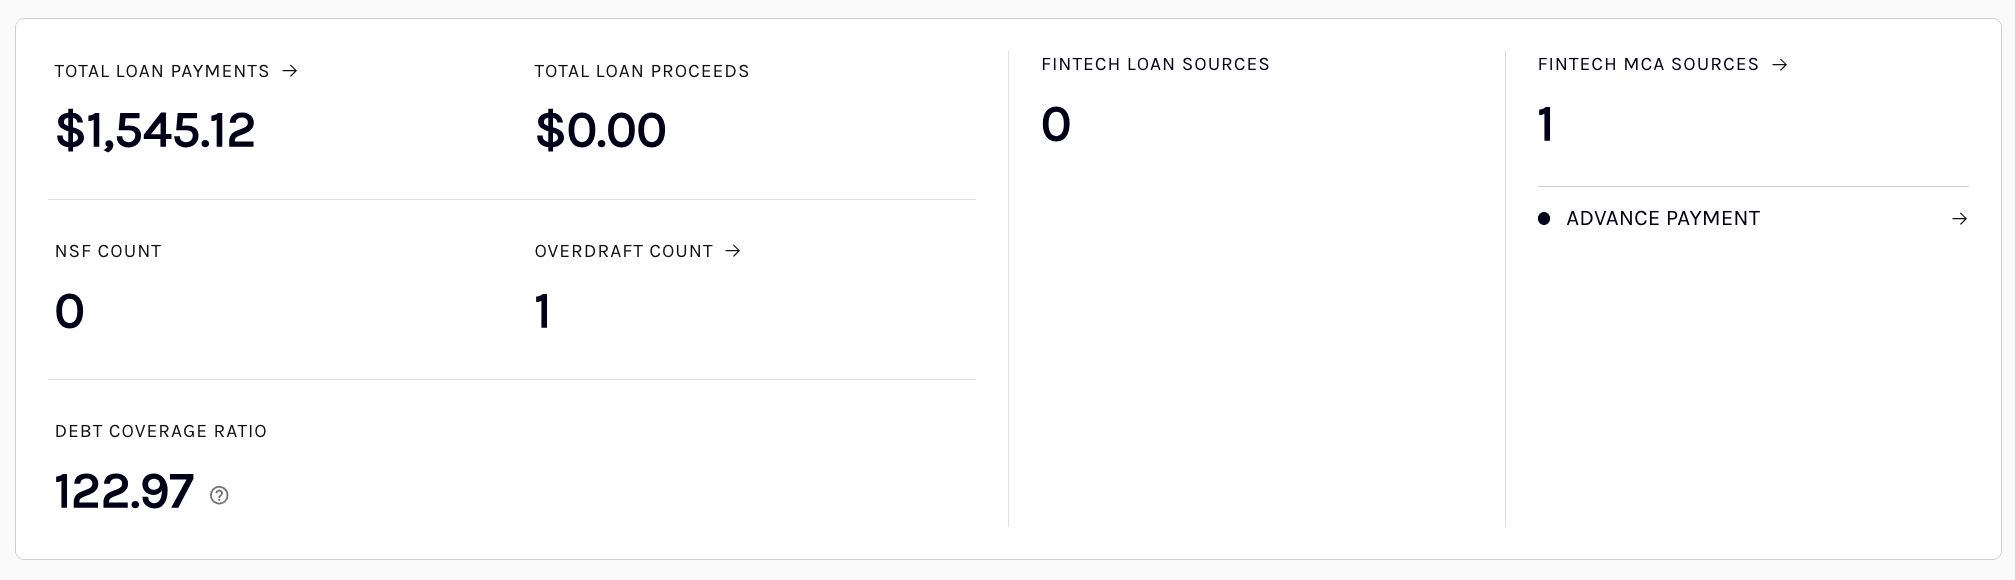
Summary metrics
A fixed metrics bar displays top-level indicators of borrower behavior and financial health, giving you a quick read on lending risk without navigating deeper into the Book.
The table below outlines the metrics displayed in the summary metrics bar:
| Metric | Description |
|---|---|
| Total loan proceeds | The total amount of capital received from lenders. Displayed in USD |
| Total loan payments | The total amount repaid by the merchant toward loans. Displayed in USD |
| Average daily balance | The average balance maintained across all accounts. Helps assess liquidity |
| Debt coverage ratio | Ratio of revenue minus expenses net of debt payments to total debt payments |
| NSF count | The total number of non-sufficient funds events |
| Overdraft count | The total number of overdraft occurrences |
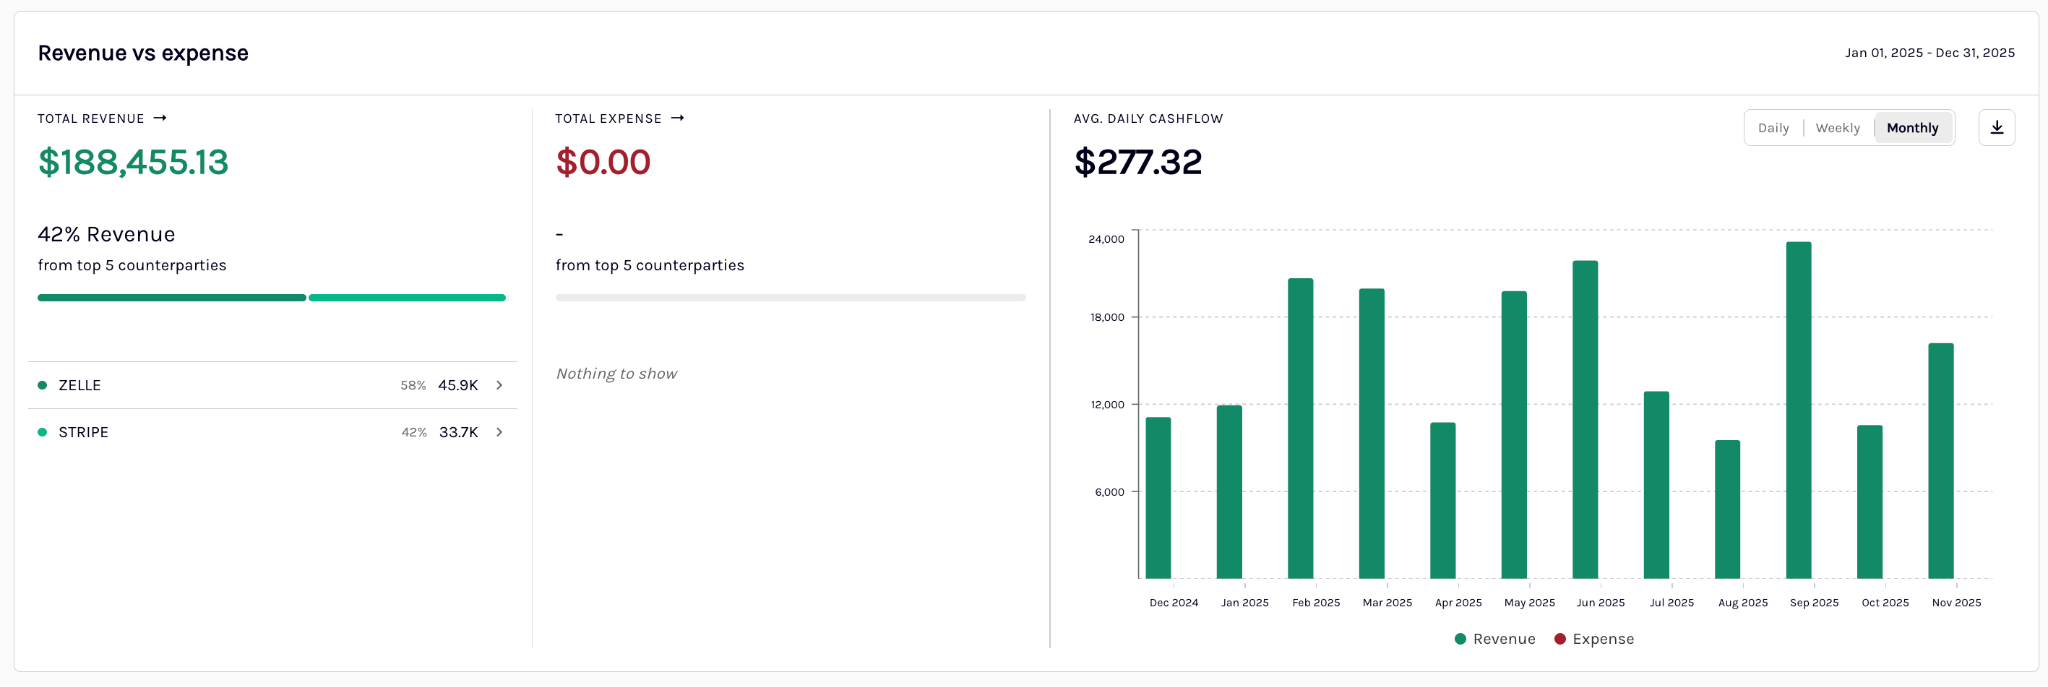
Revenue, expense, and counterparty card
Beneath the summary metrics, a row of insight cards summarizes revenue, expenses, and fintech counterparty data to give you a quick view of the primary sources of inflow and outflow.
The table below outlines the card categories and metrics:
| Metric | Description |
|---|---|
| Fintech loan sources | The number of fintech loan lenders and their names such as Credibly, and ClearCo |
| Fintech MCA sources | The number of fintech MCA providers and their names |
| Revenue summary | Total revenue in USD and the top 5 revenue counterparties, with each counterparty's percent contribution to total revenue |
| Expense summary | Total expenses in USD and the top 5 expense counterparties, with each counterparty's percent contribution to total expenses |
Right-side panel widgets
Two stacked cards on the right provide context on the borrower's business classification and banking footprint. They help you validate industry assumptions, assess how complete the bank data is, and confirm that every relevant account is captured in the document set.
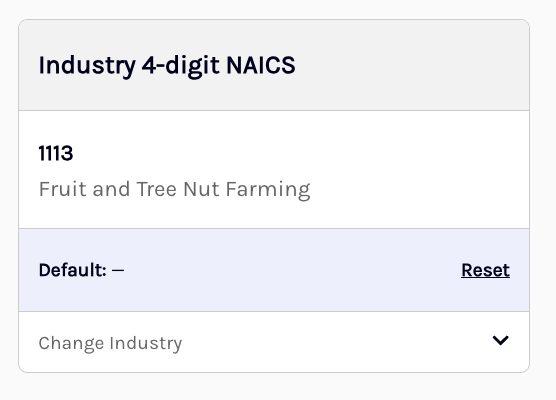
Industry classification widget
This widget displays the borrower's 4-digit NAICS code and corresponding business description for Books where Ocrolus has successfully identified a primary merchant. Underwriters can override the system-assigned classification using the Change Industry button, or revert to the original value with Reset to System Assigned, which appears only after a manual update has been made.
When Ocrolus cannot confidently identify a primary business such as in Books containing multiple businesses or fragmented merchant activity the widget displays one of the following statuses:
| Status | Description |
|---|---|
| Pending - Industry Data | Classification is in progress |
| Unable to find a unique SMB merchant | A unique merchant mapped to the documents in the Book could not be identified |
| Not Available | A unique merchant was found, but industry classification data is unavailable |
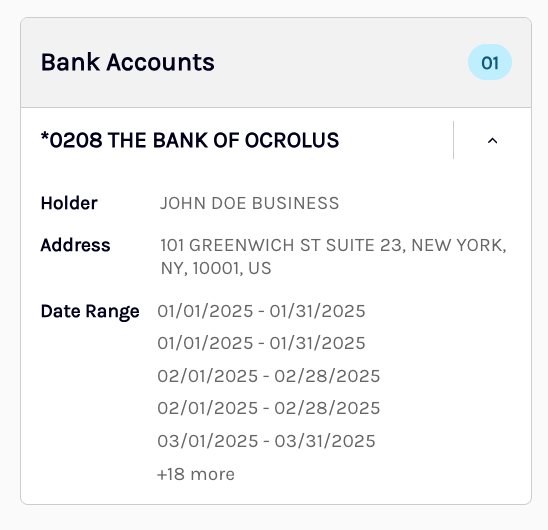
Bank accounts widget
This widget shows the total number of bank accounts included in the Book and presents them in an accordion format. Each accordion header displays the account number and bank name. Expanding an account reveals the following details:
| Field | Description |
|---|---|
| Account holder name | The name of the individual or entity associated with the account |
| Statement date ranges | The date ranges covered by the account's statements, summarized with +n more where applicable |
| Total statement months | The total number of statement months included |
| Account holder address | The address associated with the account holder |
Dashboard metrics
For the full definition and format of each Book Overview metric, see the list of available metrics on the Book Overview tab of the Ocrolus dashboard.
Updated 8 days ago