
Accounts section
The Accounts page provides a comprehensive summary of key account and cash flow information. It offers a quick overview either by individual bank account or at the Book level. It includes a snapshot of cash flow metrics along with multiple visualizations and enables you to display specific data needed to analyze a merchant's cash flow. Important details such as bank account types and numbers, debt coverage ratios, account balances, and potential red flags like negative balances or non-sufficient funds (NSFs) are easily identifiable to help you streamline your financial analysis.
This page provides the following insights to help you work with cash flow analytics:
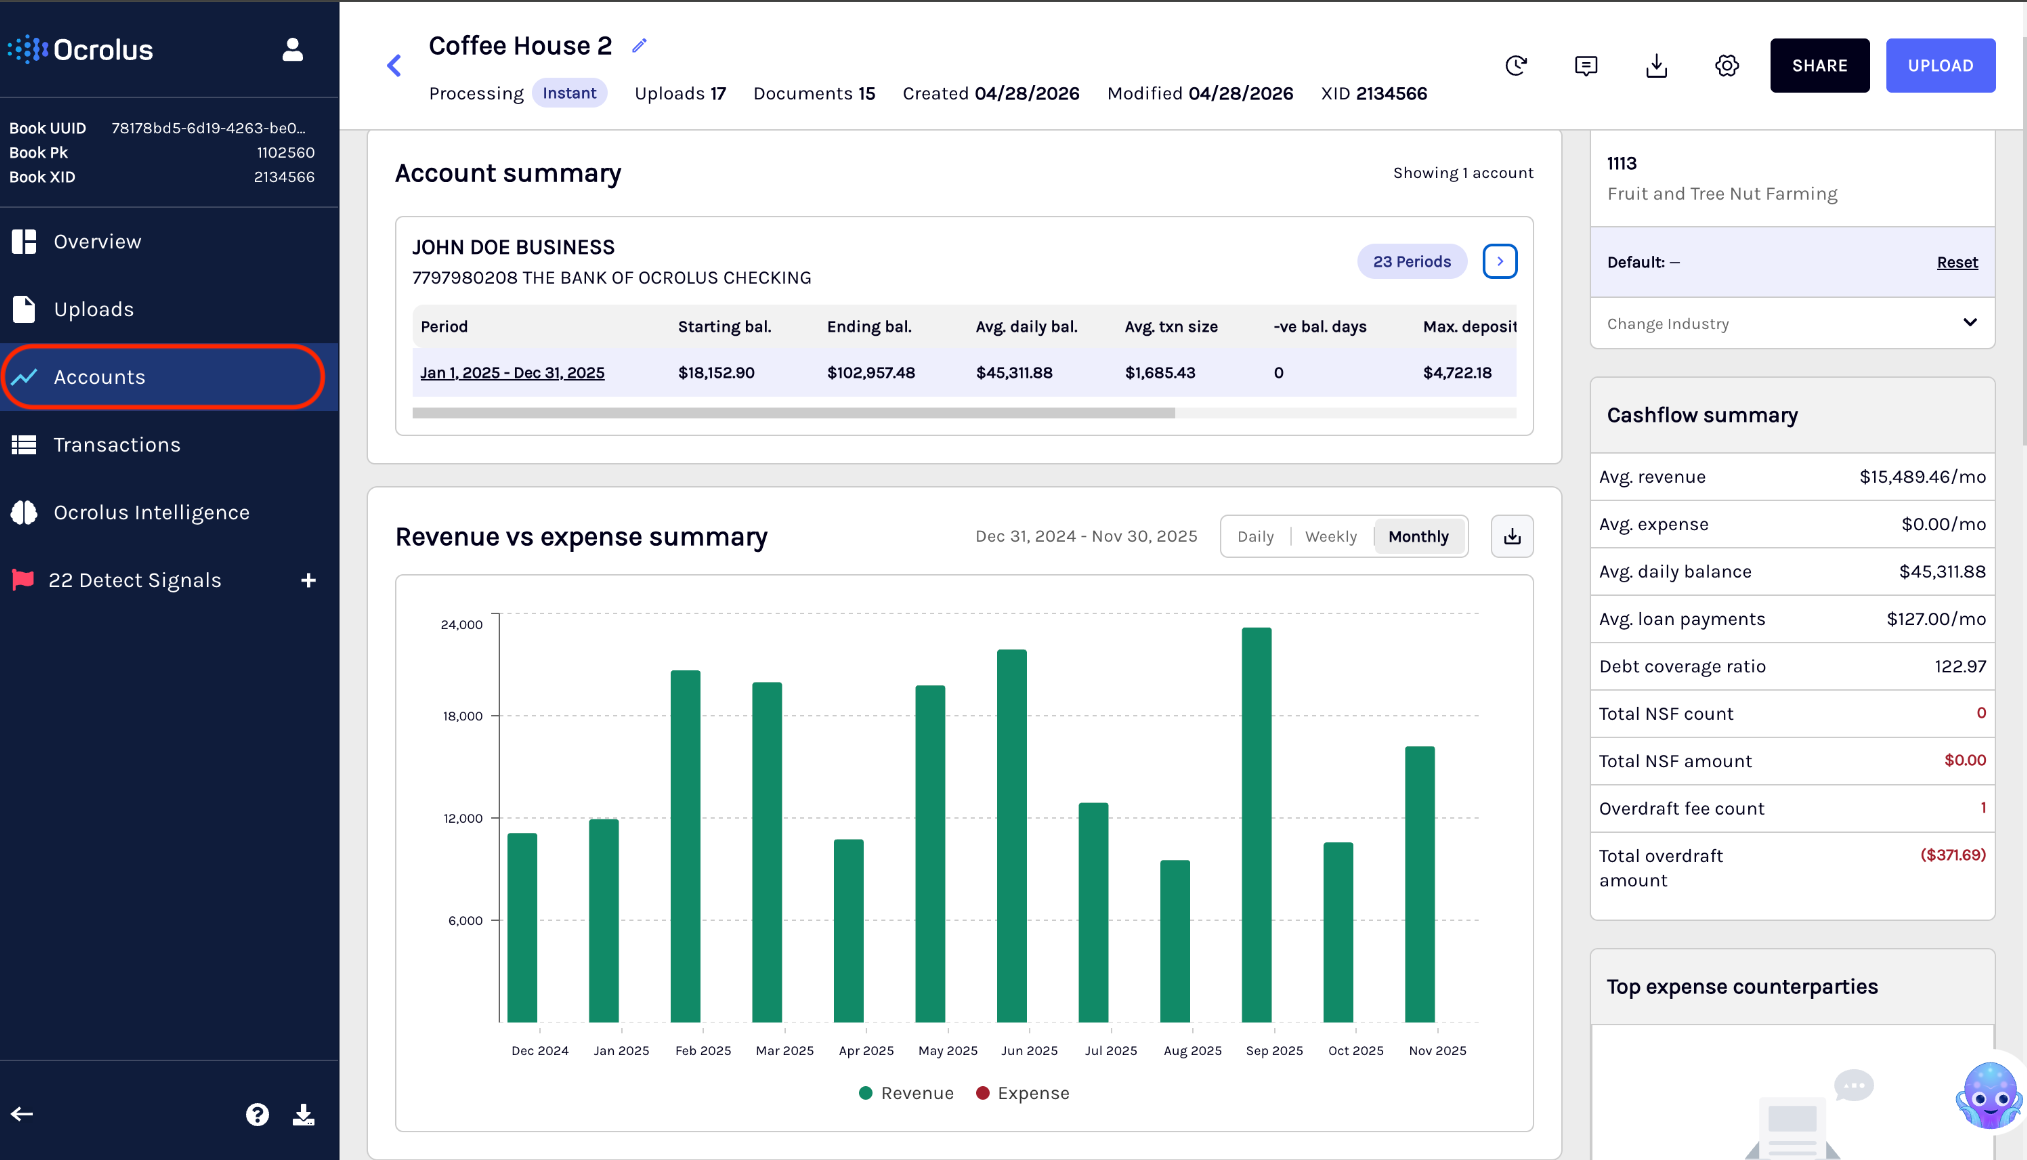
Account summary
The Accounts page offers a summary of all accounts within the Book to highlight key cash flow metrics for each account. This information assists lenders in evaluating the reliability of a merchant's cash flow.
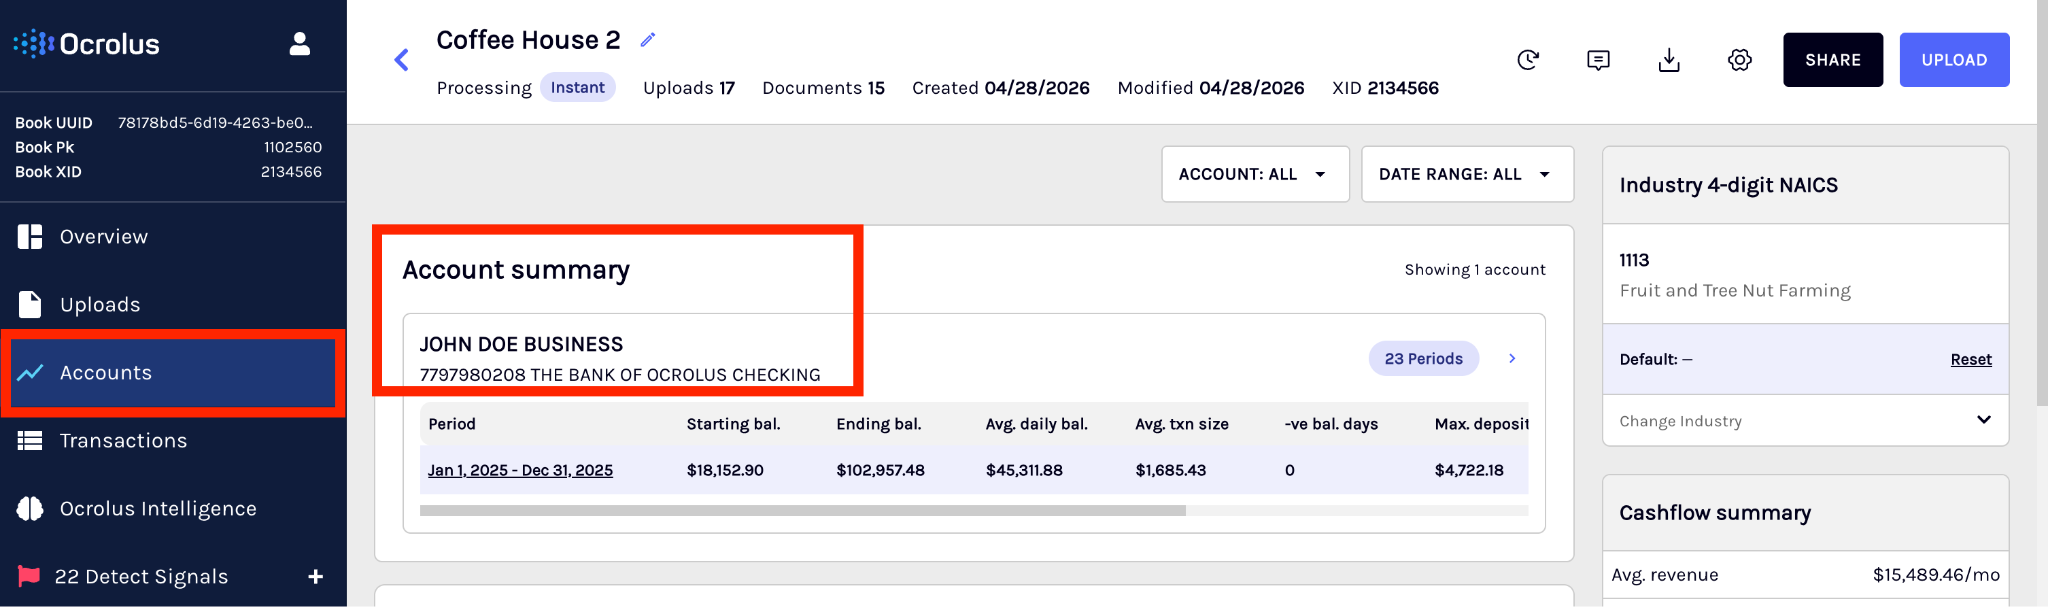
Account data is organized by statement periods rather than a single continuous date range. Each period represents the date span covered by the account's statements. This makes it easier to filter and navigate data by statement date.
The table below outlines the available fields in the Account Summary section, along with their corresponding descriptions:
| Field | Description |
|---|---|
| Account Holder | The individual or entity responsible for the account, whose cash flow is being analyzed. |
| Account | The specific bank account associated with the merchant's cash flow metrics and analytics. |
| Begin Date | The start date for the period over which the cash flow analysis is being conducted. |
| End Date | The end date for the period over which the cash flow analysis is being conducted. |
| Beginning Balance | The account balance at the start of the specified period. This balance is used to provide a baseline for cash flow calculations. |
| Ending Balance | The account balance at the end of the specified period. This balance summarizes net cash flow over the period. |
| Average Daily Balance | The average account balance is calculated on a daily basis. It provides insight into overall liquidity during the period. |
| Average Transaction Size | The average value of transactions during the specified period. It is useful for understanding transaction patterns and cash flow. |
| Days of Negative Balance | The total number of days within the period when the account balance was negative. It indicates potential financial risk. |
| Max Deposit | The highest deposit amount made into the account during the specified period. |
| Max Withdrawal | The highest withdrawal amount from the account during the specified period. |
| Average Deposit | The average deposit amount across all deposits within the specified period which shows typical inflow sizes. |
| Average Withdrawal | The average withdrawal amount across all withdrawals within the specified period which indicates the typical size of outflows. |
Right-side panel widgets
The right side panel of the screen provides a quick, at-a-glance summary of key business and financial information to support faster decision-making. This section includes widgets for Industry details, a Cash Flow Summary, the Top 5 Revenue Counterparties, and the Top 5 Expense Counterparties. Together, these widgets give you a consolidated view of critical data points without needing to navigate away from the main analysis screen.
Industry
The Industry widget displays the merchant's primary North American Industry Classification System (NAICS) classification, where applicable. This helps underwriters contextualize financial activity based on industry norms.
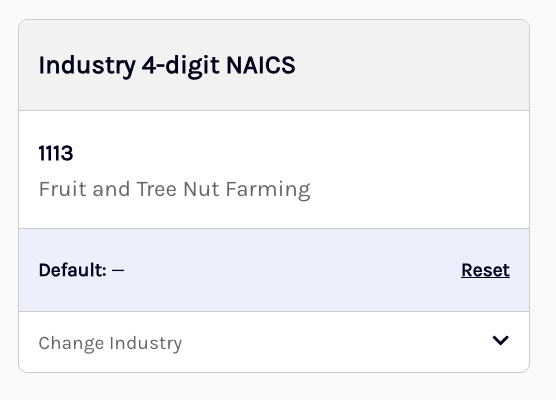
The widget displays the following details when Ocrolus can confidently determine the merchant's primary business:
| Field | Description |
|---|---|
| NAICS Code | A 4-digit industry classification code such as 7225 for Food Services |
| Industry Description | A readable label for the business type |
| Override Industry | Allows underwriters to update the classification manually |
| Reset to System Assigned | Reverts the classification to the Ocrolus-assigned value. Appears only if a manual change has been made |
For Books with multiple businesses or fragmented merchant activity, the widget may display one of the following statuses:
| Status | Description |
|---|---|
| Pending — Industry Data | Classification is in progress |
| Unable to find a unique SMB merchant | A unique merchant mapped to the documents in the book could not be identified |
| Not Available | A unique merchant was found, but industry classification data is unavailable |
Cash flow
The Cash Flow widget provides a compact sidebar summary of key financial behavior metrics to help underwriters assess the merchant's overall liquidity and risk profile without needing to navigate graphs or tables.
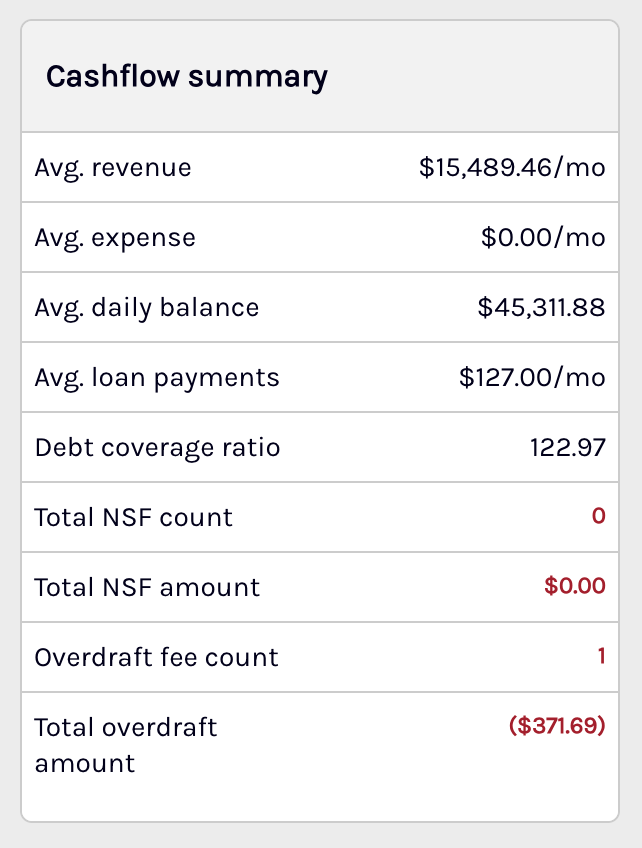
The table below outlines the available metrics in the Cash Flow widget along with their corresponding descriptions:
| Metric | Description |
|---|---|
| Average Revenue | Average revenue across all months |
| Average Expense | Average monthly expenses in USD, used to assess the cost structure |
| Average Daily Balance | Mean daily account balance across the Book, indicating liquidity trends |
| Average Loan Payments | Mean monthly debt repayments |
| Debt Coverage Ratio | Ratio of revenue minus expenses net of debt payments to total debt payments |
| Total NSF Count | Number of Non-Sufficient Funds incidents |
| Total NSF Amount | Total amount of NSF transactions in USD |
| Overdraft Fee Count | Number of overdraft fee charges |
| Total Overdraft Amount | Total amount of overdraft fees in USD |
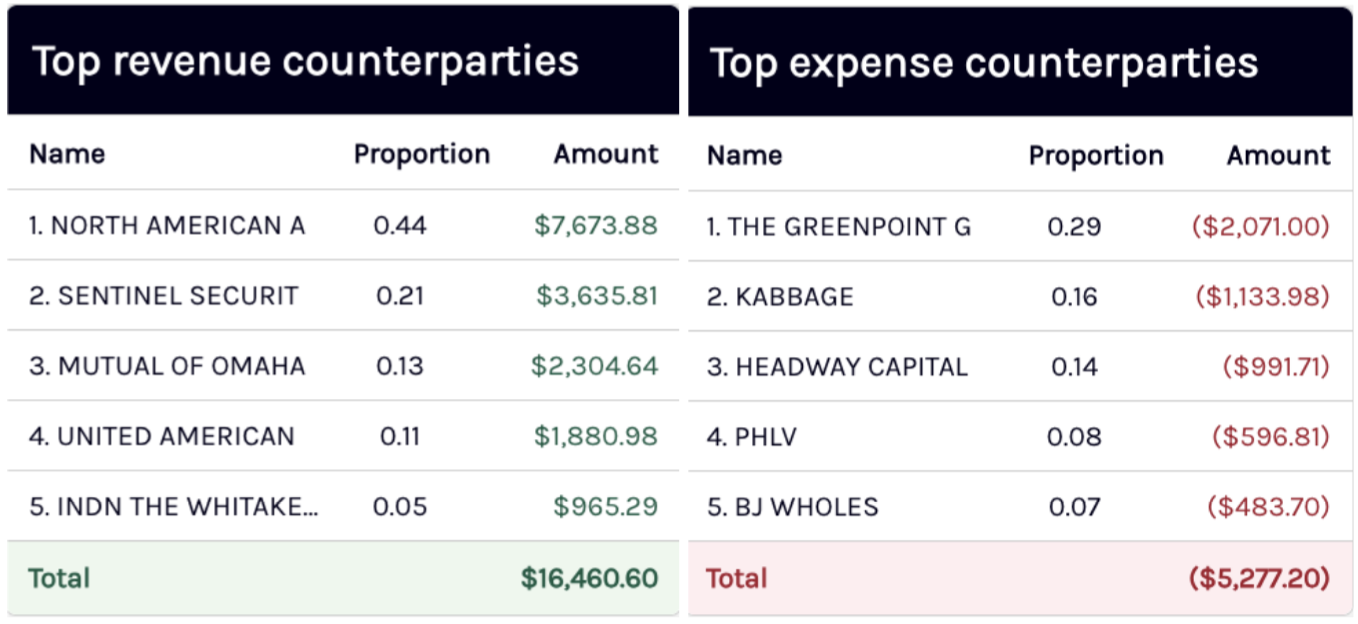
Top 5 revenue and expense counterparty
This section displays two sidebar widgets, highlighting the top five revenue and expense counterparties based on transaction value. These widgets help underwriters quickly identify income concentration and potential expense risks.
Visualizations
The Dashboard provides three interactive visualizations that enable lenders to quickly assess their merchant's cash flow and spending habits. These visualizations include Balance History, which tracks changes in account balances over time, Revenue vs Expense, which compares income and expenditures, and Summary by Transaction Tag, which categorizes transactions for a clearer view of spending patterns. Together, these tools offer a comprehensive overview of a merchant's financial behavior.
You can download all visualizations along with their corresponding data in the image (.png) or data (.csv) format. To download, click on Export option located in the top-right corner of each visualization, and select the appropriate option from the dropdown list.

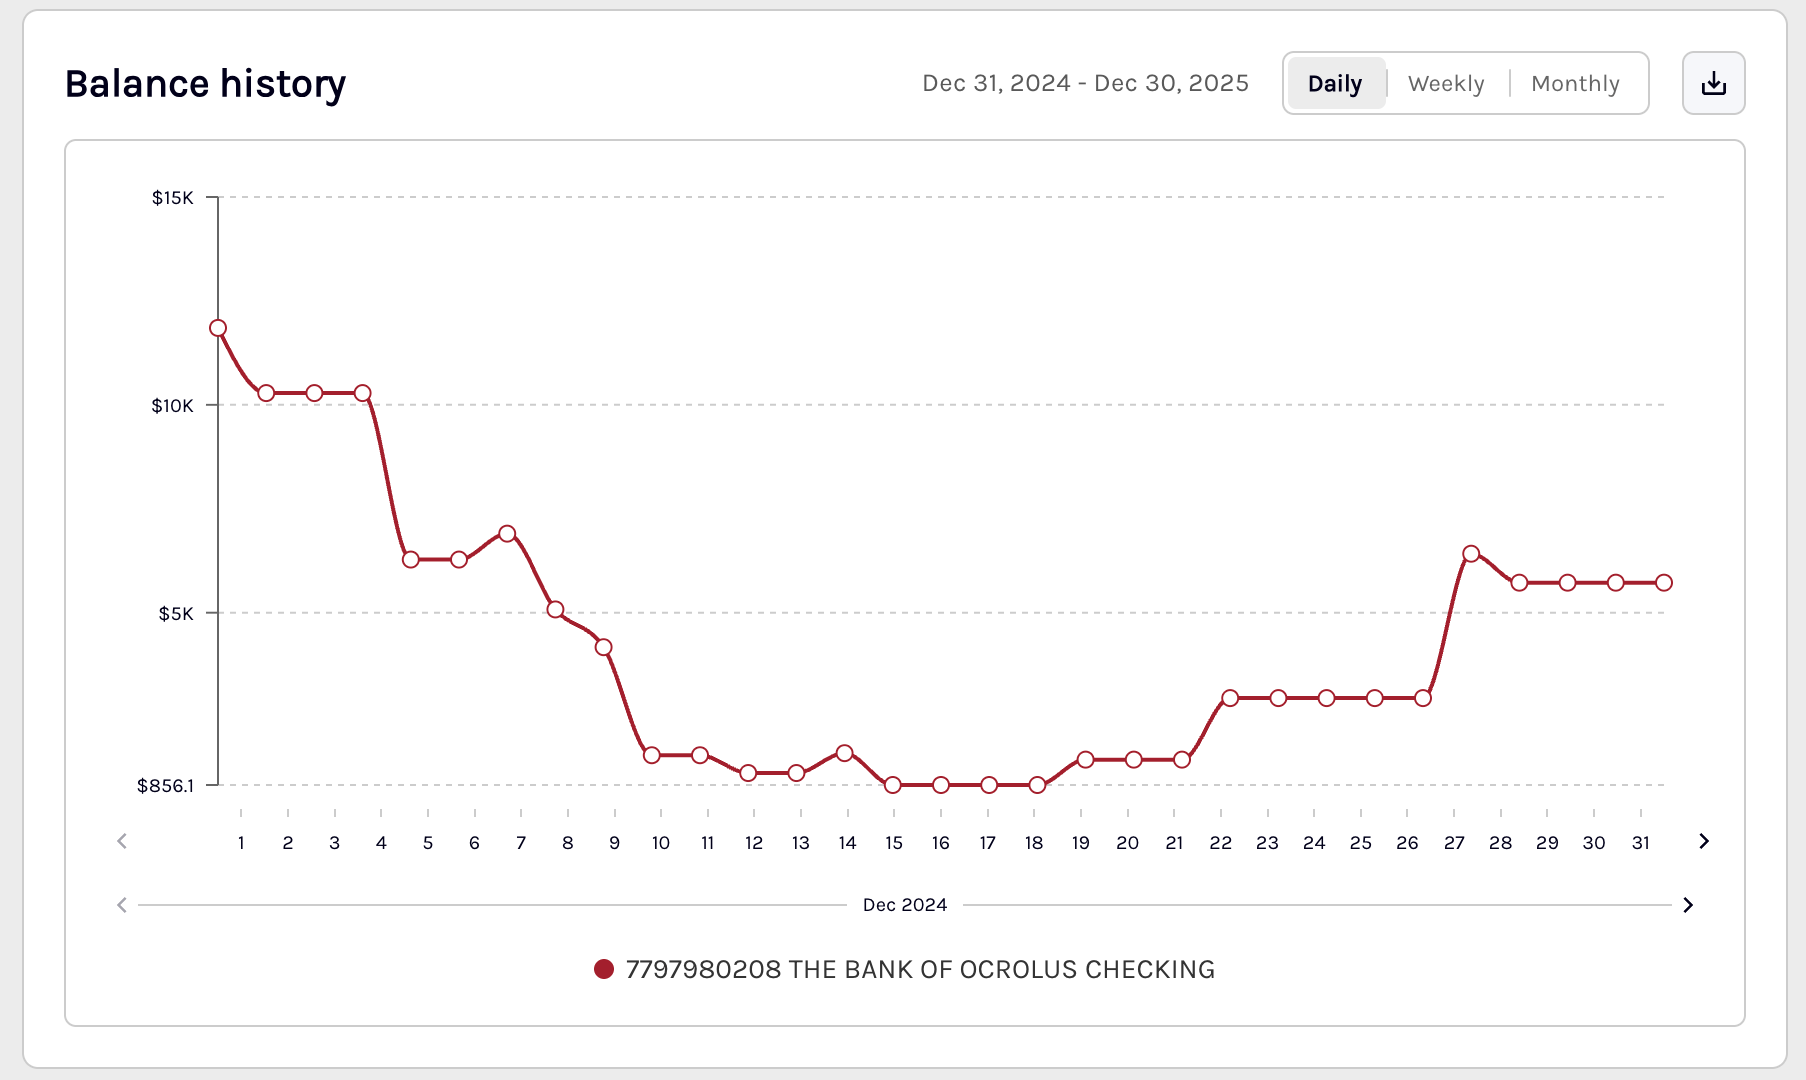
You can also set the range for the balance history over the graph. The available options are Daily, Weekly, and Monthly.
The data used to generate the Revenue vs Expense and Summary by Transaction Tag visualizations can be updated on the Transactions page. Any adjustments made to revenue or transaction tags on the Transactions page will be reflected in the visualizations and in the exportable images or data. To learn more about the Transaction page, see the Transactions section.
Balance history
This interactive visualization allows you to view a merchant's cash flow by account, with options to see a daily, weekly, or monthly history. You can also export the visualization and its underlying data. It helps you quickly identify any spikes, declines, or gaps in the balance that may require closer examination.
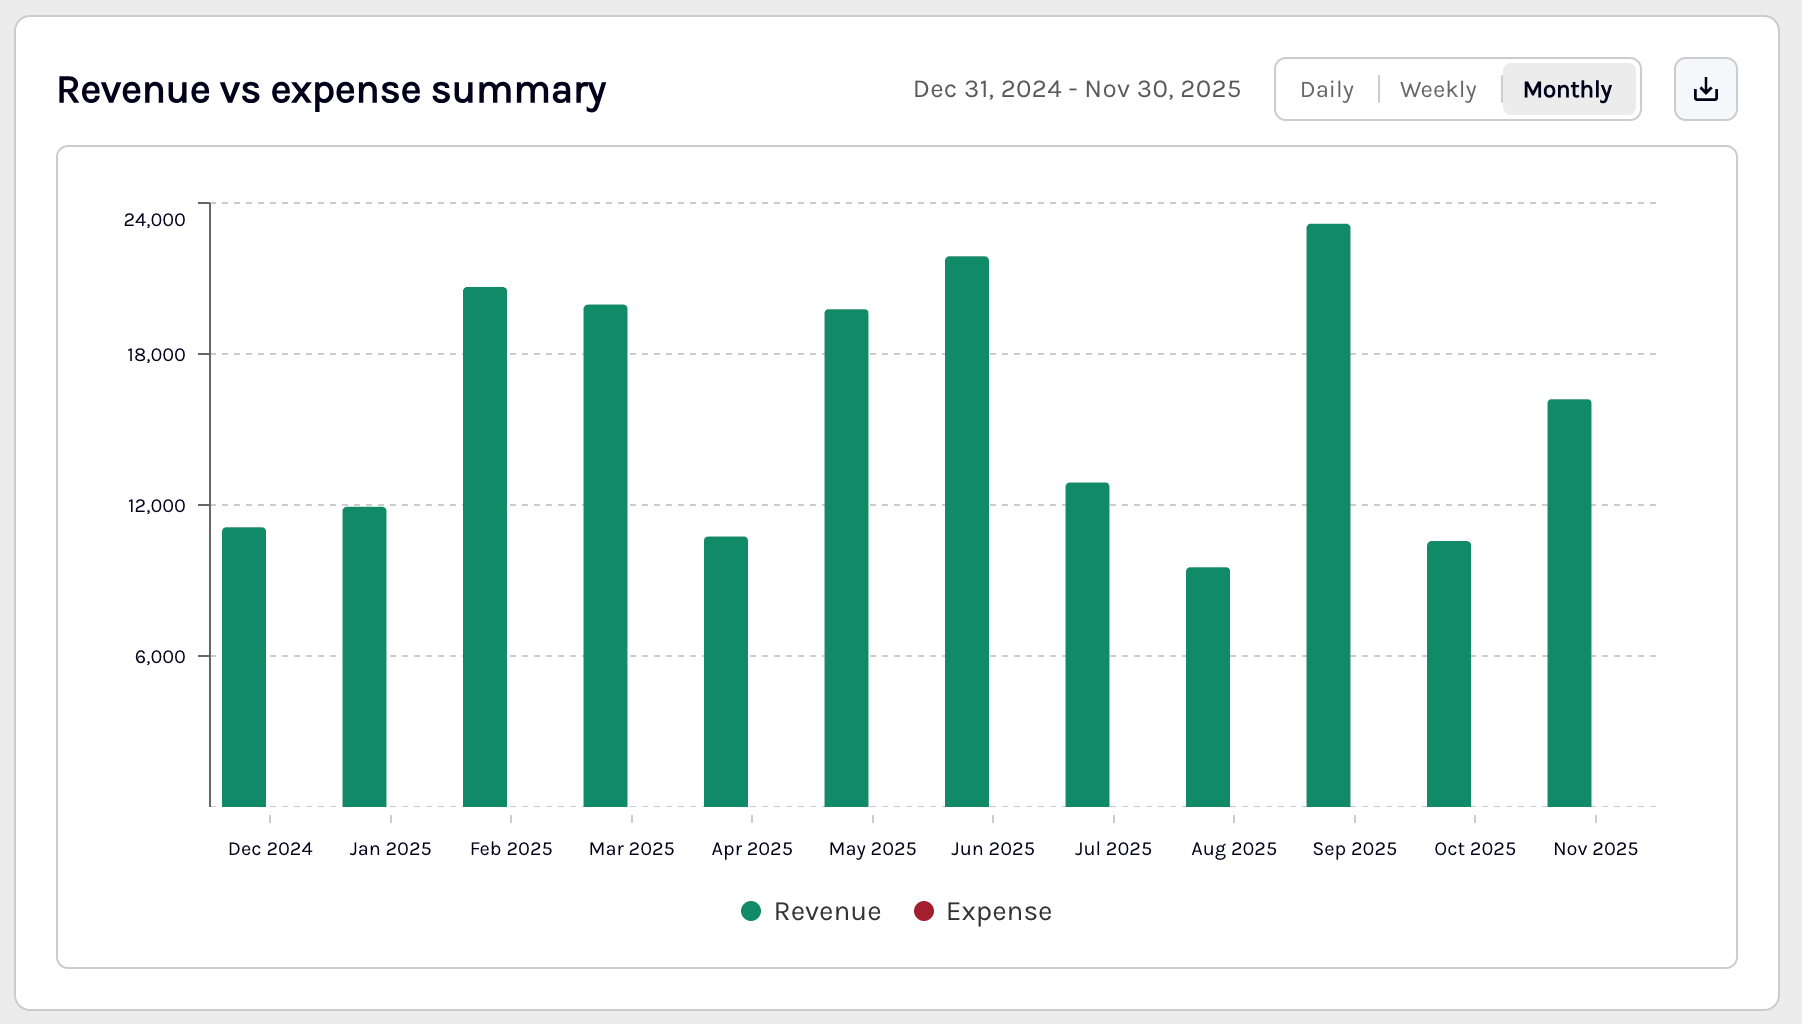
Revenue vs. Expense
This interactive visualization allows you to see a merchant's Revenue (income) vs. Expense (spending) and helps lenders assess the financial health of merchants and identify trends in their income and expenditures. All transactions tagged as revenue can be viewed and managed on the Transactions page, where you can also add or remove transactions to include or exclude them from revenue calculations. To learn more about the Transaction page, see the Transactions section.
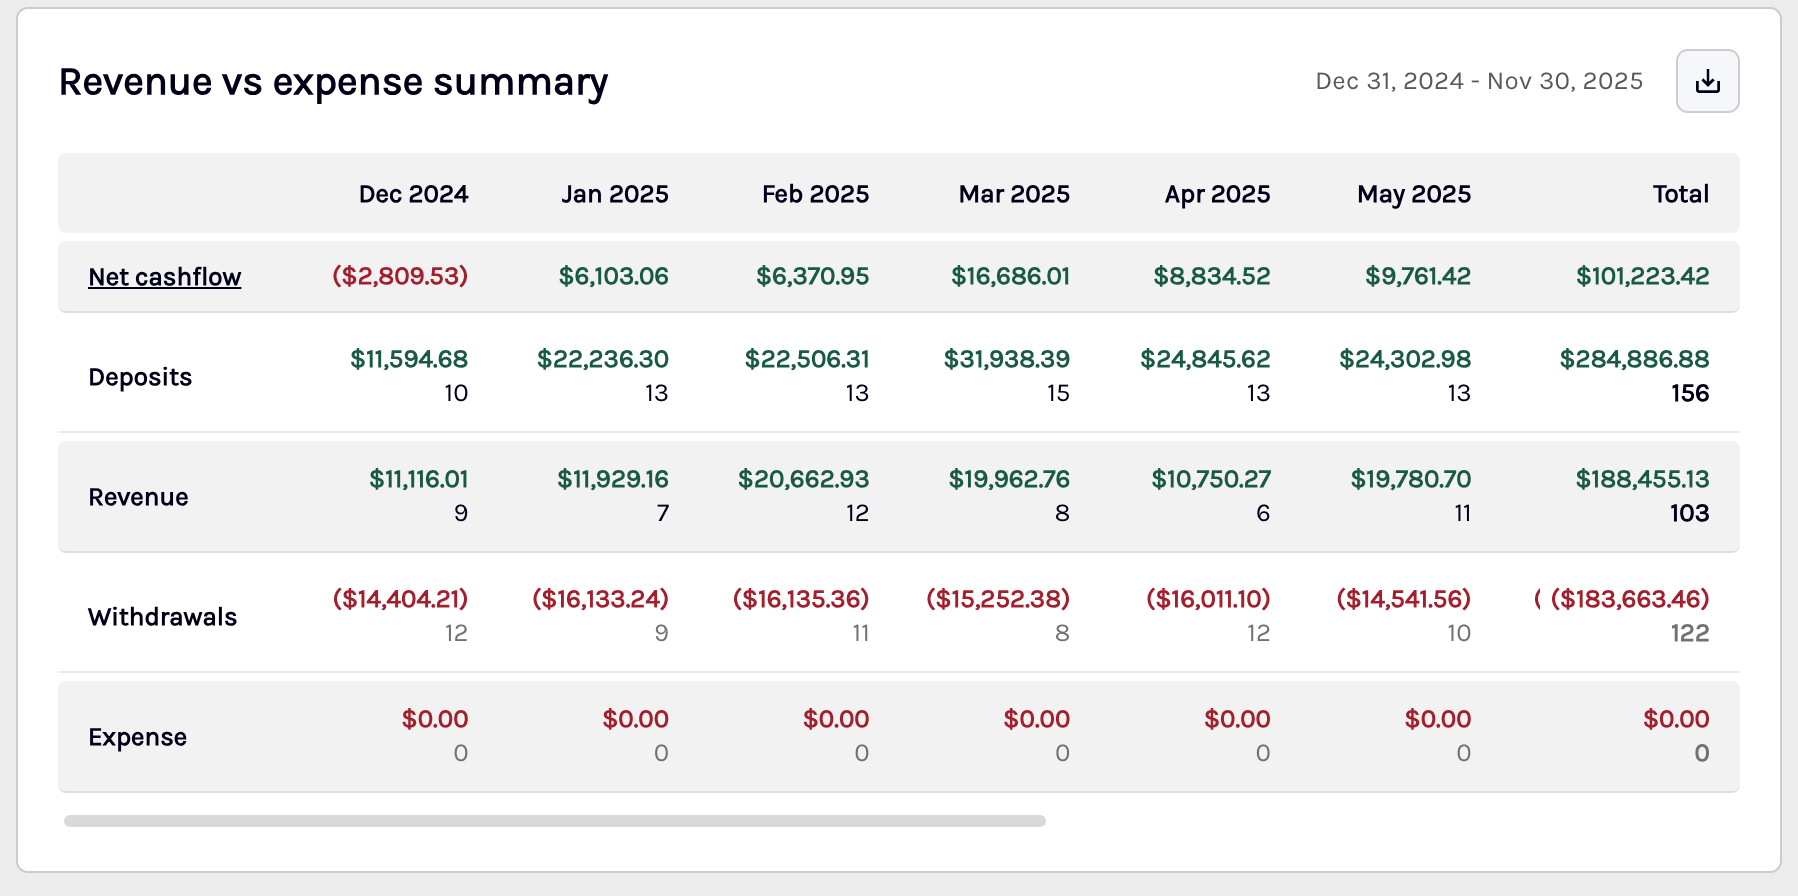
Revenue vs. expense summary
The Revenue vs Expense summary table appears directly below the Revenue vs Expense visualization and provides a detailed breakdown of monthly inflows and outflows across the Book. This table helps underwriters understand not just the size but also the volume of transactions over time.
The table displays four rows of metrics: Revenue, Expense, Deposits, and Withdrawals where each row split into amount (USD) and transaction count for each month. A frozen Total column on the far right shows the aggregate across the entire time period.
| Metric | Description |
|---|---|
| Revenue & Revenue Count | Total income tagged as revenue for each month and the corresponding number of revenue transactions |
| Expense & Expense Count | Total outflows tagged as expenses for each month and the corresponding number of expense transactions |
| Deposits & Count | Sum and count of all deposit transactions, whether tagged as revenue or not |
| Withdrawals & Count | Sum and count of all withdrawals, whether tagged as expenses or not |
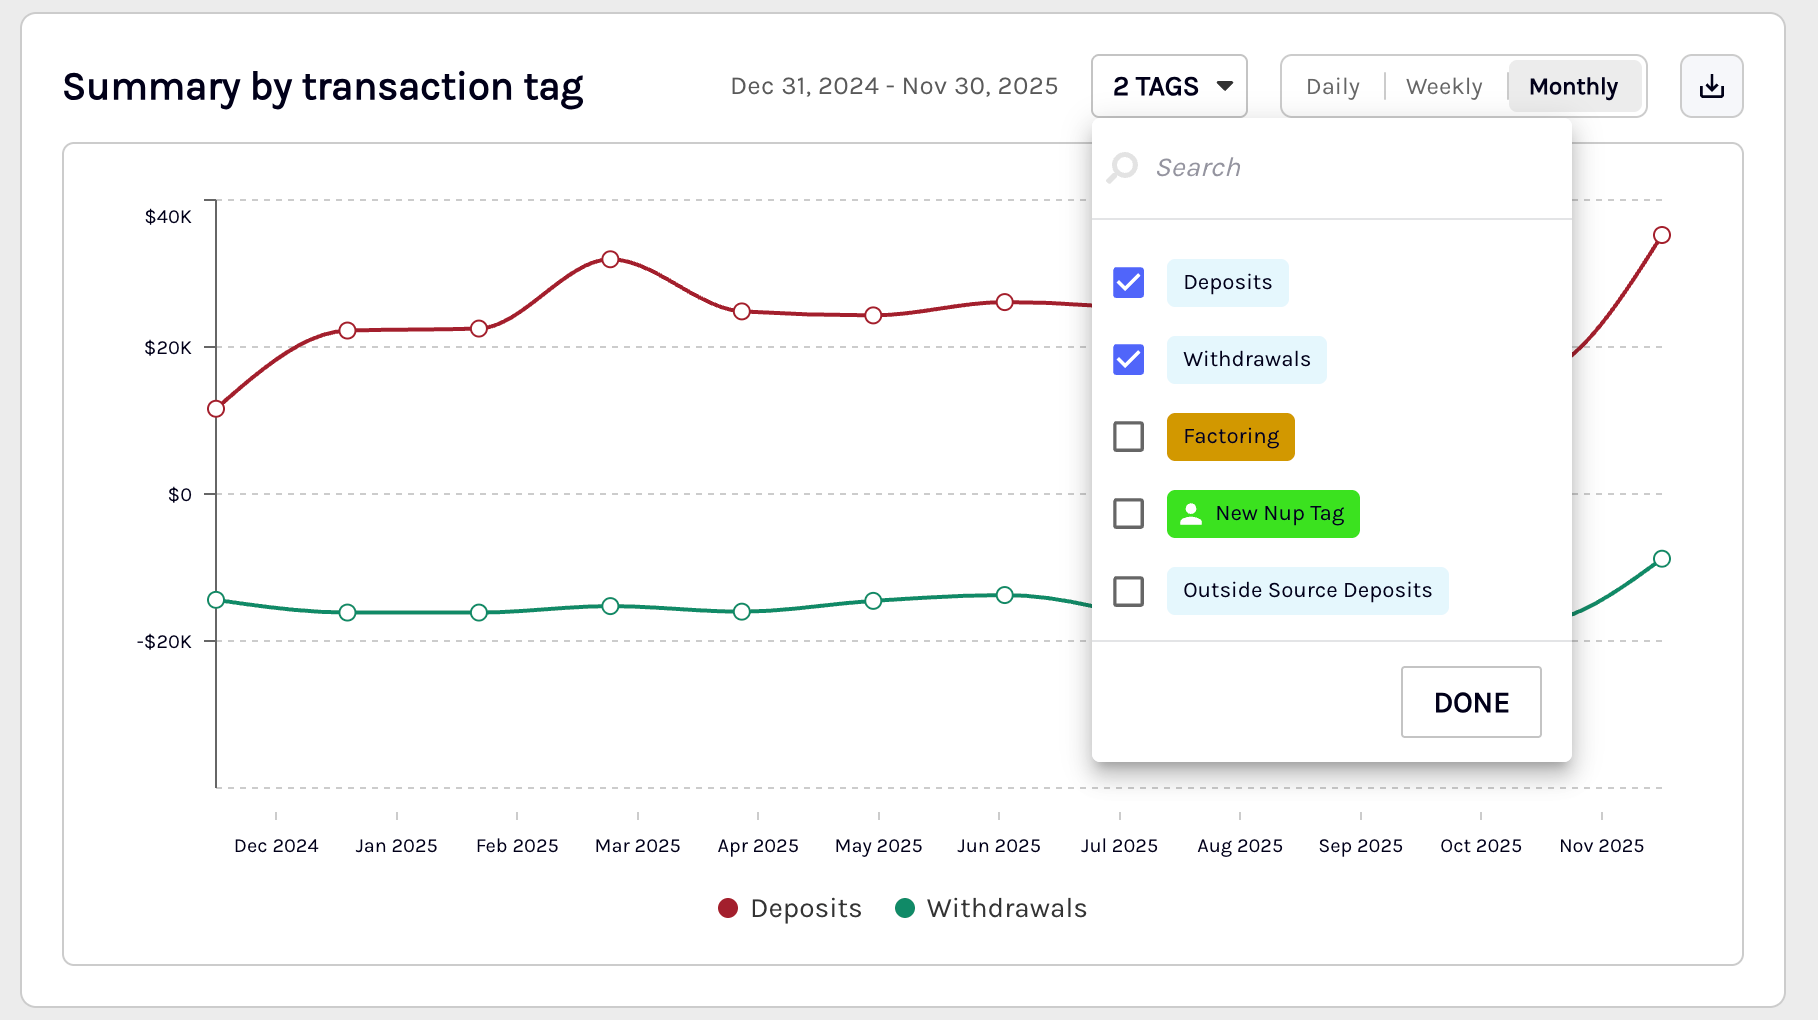
Summary by transaction tag
This interactive visualization helps lenders identify trends for specific transaction tags across all bank accounts. You can choose the transaction tags you want to analyze, with transaction amounts displayed over daily, weekly, or monthly time frames.
To view details for a specific transaction or update transaction tags associated with it, refer to the Transactions section. To know more about transaction tags and their definitions, see Ocrolus analytics data dictionary.
Dashboard metrics
Below is the complete overview of each dashboard metric available in the account section, including the metric name, its definition, and format. It serves as a quick reference to help you clearly understand what each metric represents and how the data is presented. To learn more, see the list of available metrics on the Accounts tab of the Ocrolus dashboard.
Updated 17 days ago