
Cash flow analytics
The Ocrolus Dashboard offers an easy-to-use, interactive platform for reviewing borrower insights. This guide provides an overview of the cash flow analytics available within the Dashboard. Designed specifically for lenders, Ocrolus combines industry-leading data capture and AI capabilities to deliver the most accurate data, helping lenders assess credit risk and reduce financial losses.
This guide will walk you through viewing summarized account information, accessing transaction details, customizing or updating account and transaction data, and downloading or exporting cash flow analytics reports.
The following endpoints provide curated data for advanced cash flow analysis:
Ocrolus analytics data dictionary
We have compiled an extensive cash flow analytics guide with tag names, descriptions, mapping with legacy naming conventions, and more. To download this data dictionary, click here.
If you have any additional questions, reach out to [email protected].
Ocrolus Dashboard: accessing cash flow analytics
You can access the cash flow analytics on the Accounts page and Transactions page within the Dashboard.
To navigate these pages, perform the following steps:
-
Log in to the Ocrolus Dashboard.
-
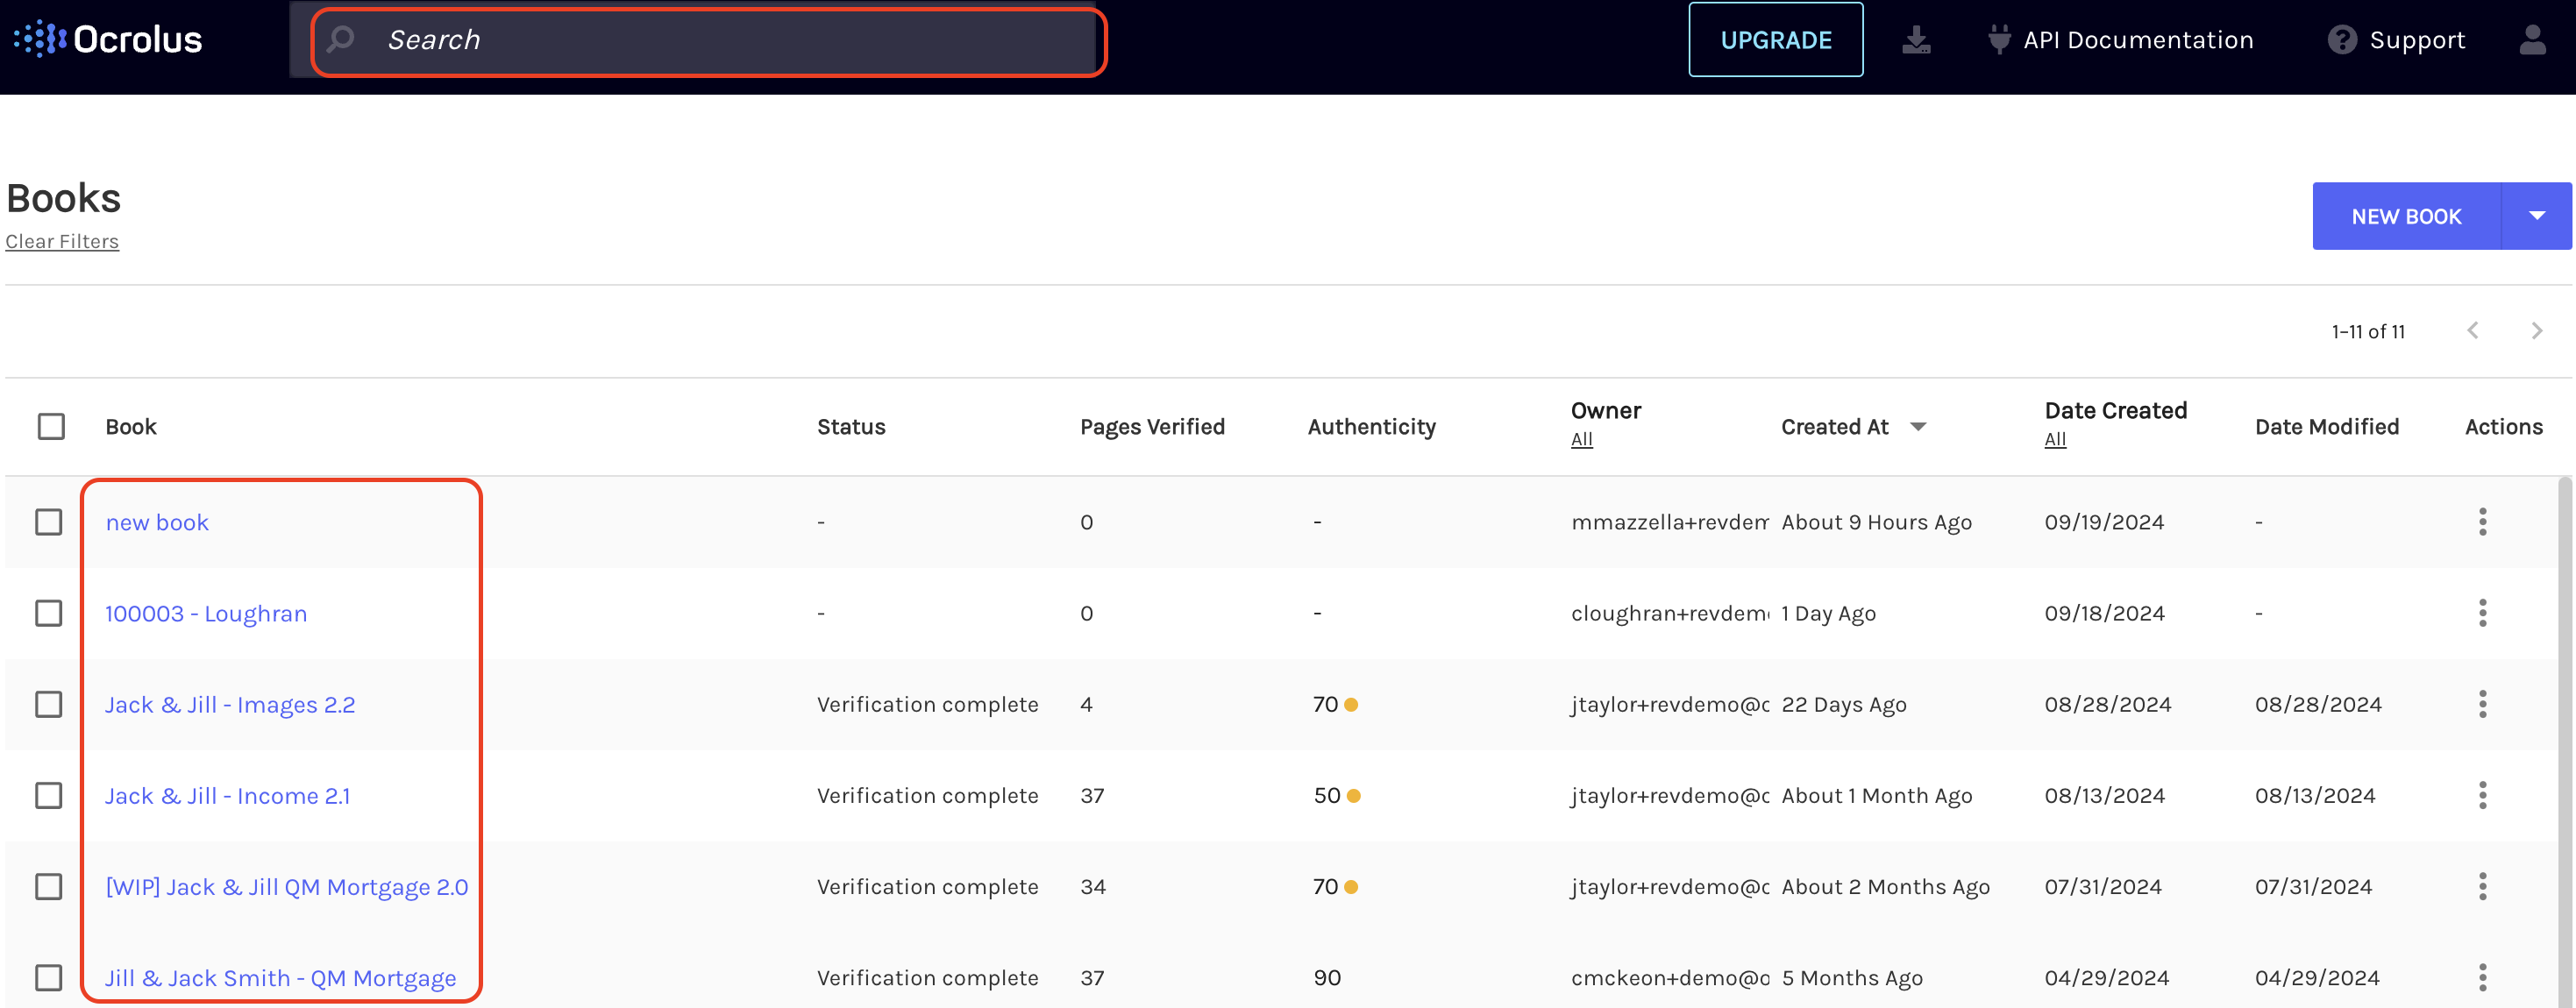
On the Book list page, click the Book you want to access for cash flow analytics. To find a specific Book, use the search bar.
-
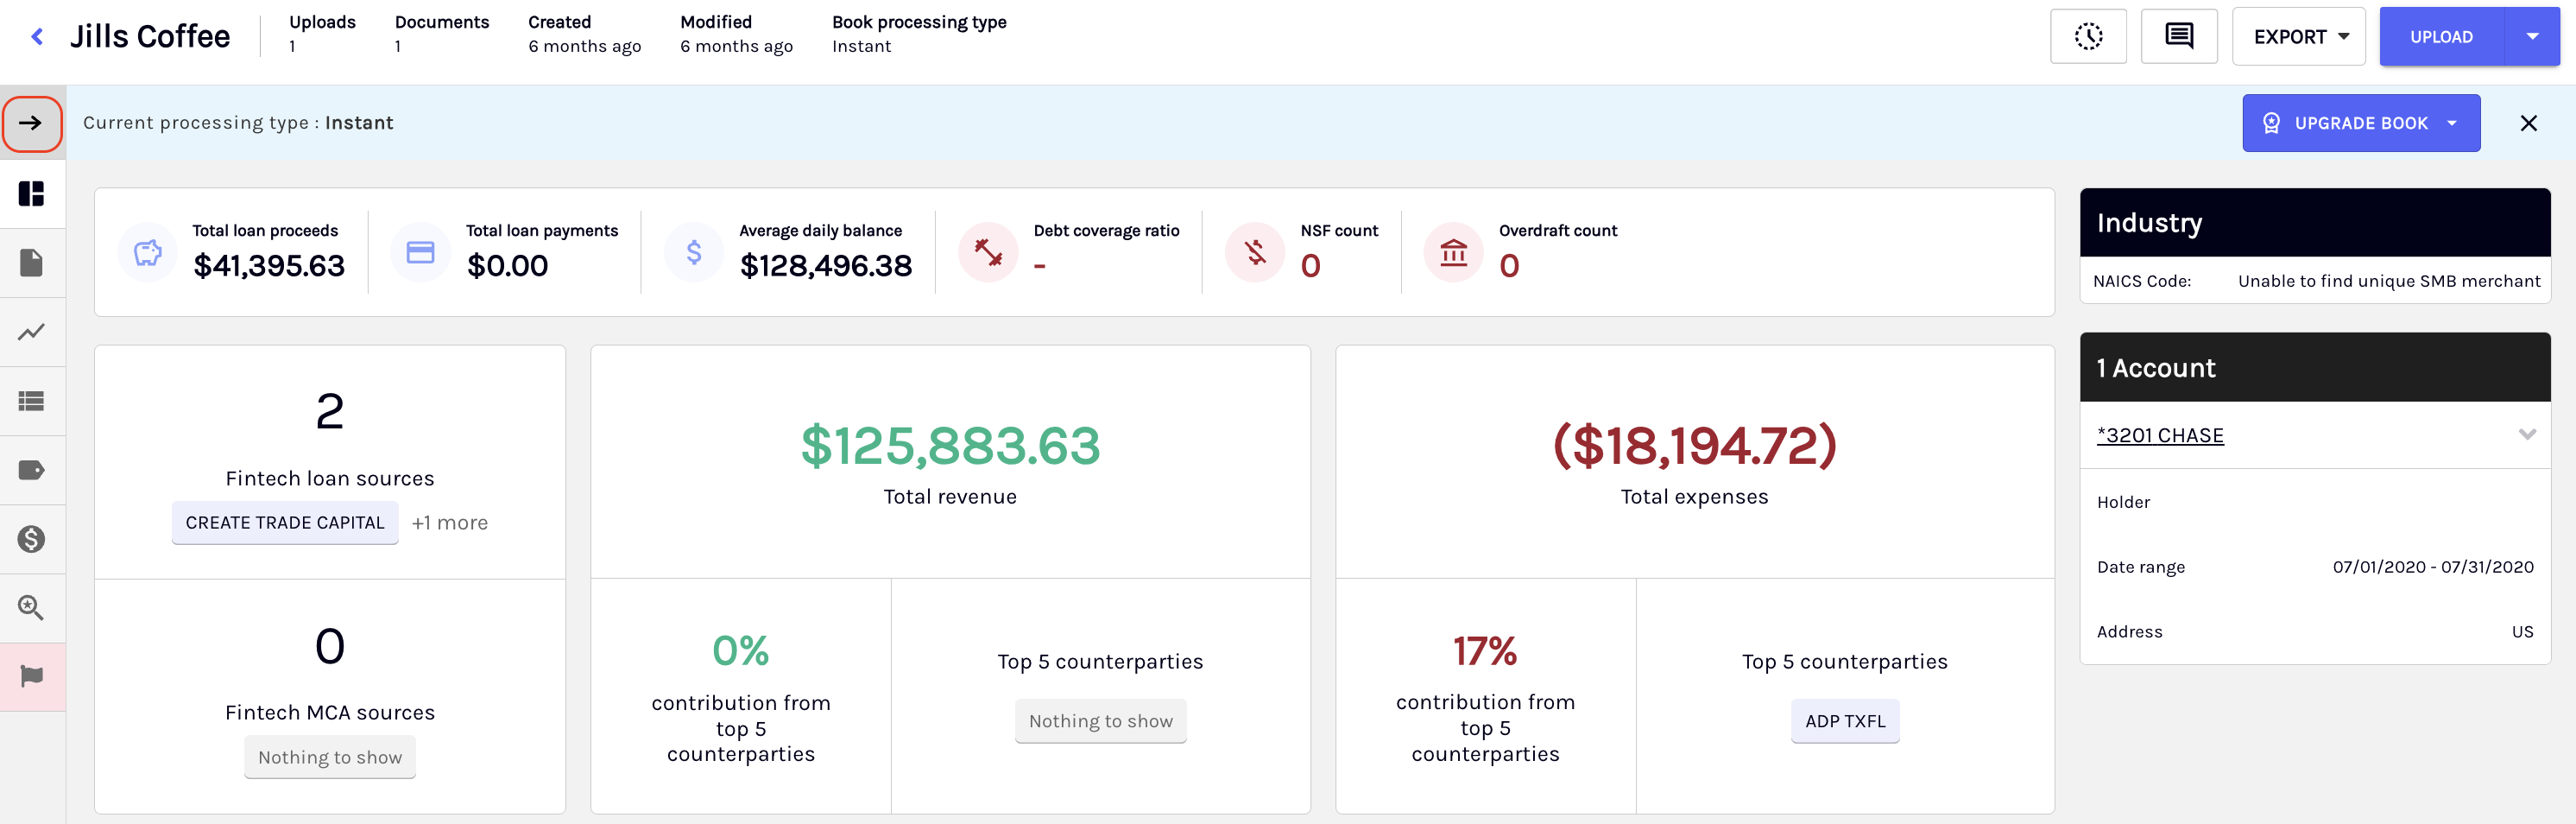
At the left corner of your screen, click on the arrow to expand the Book Summary pan.
-
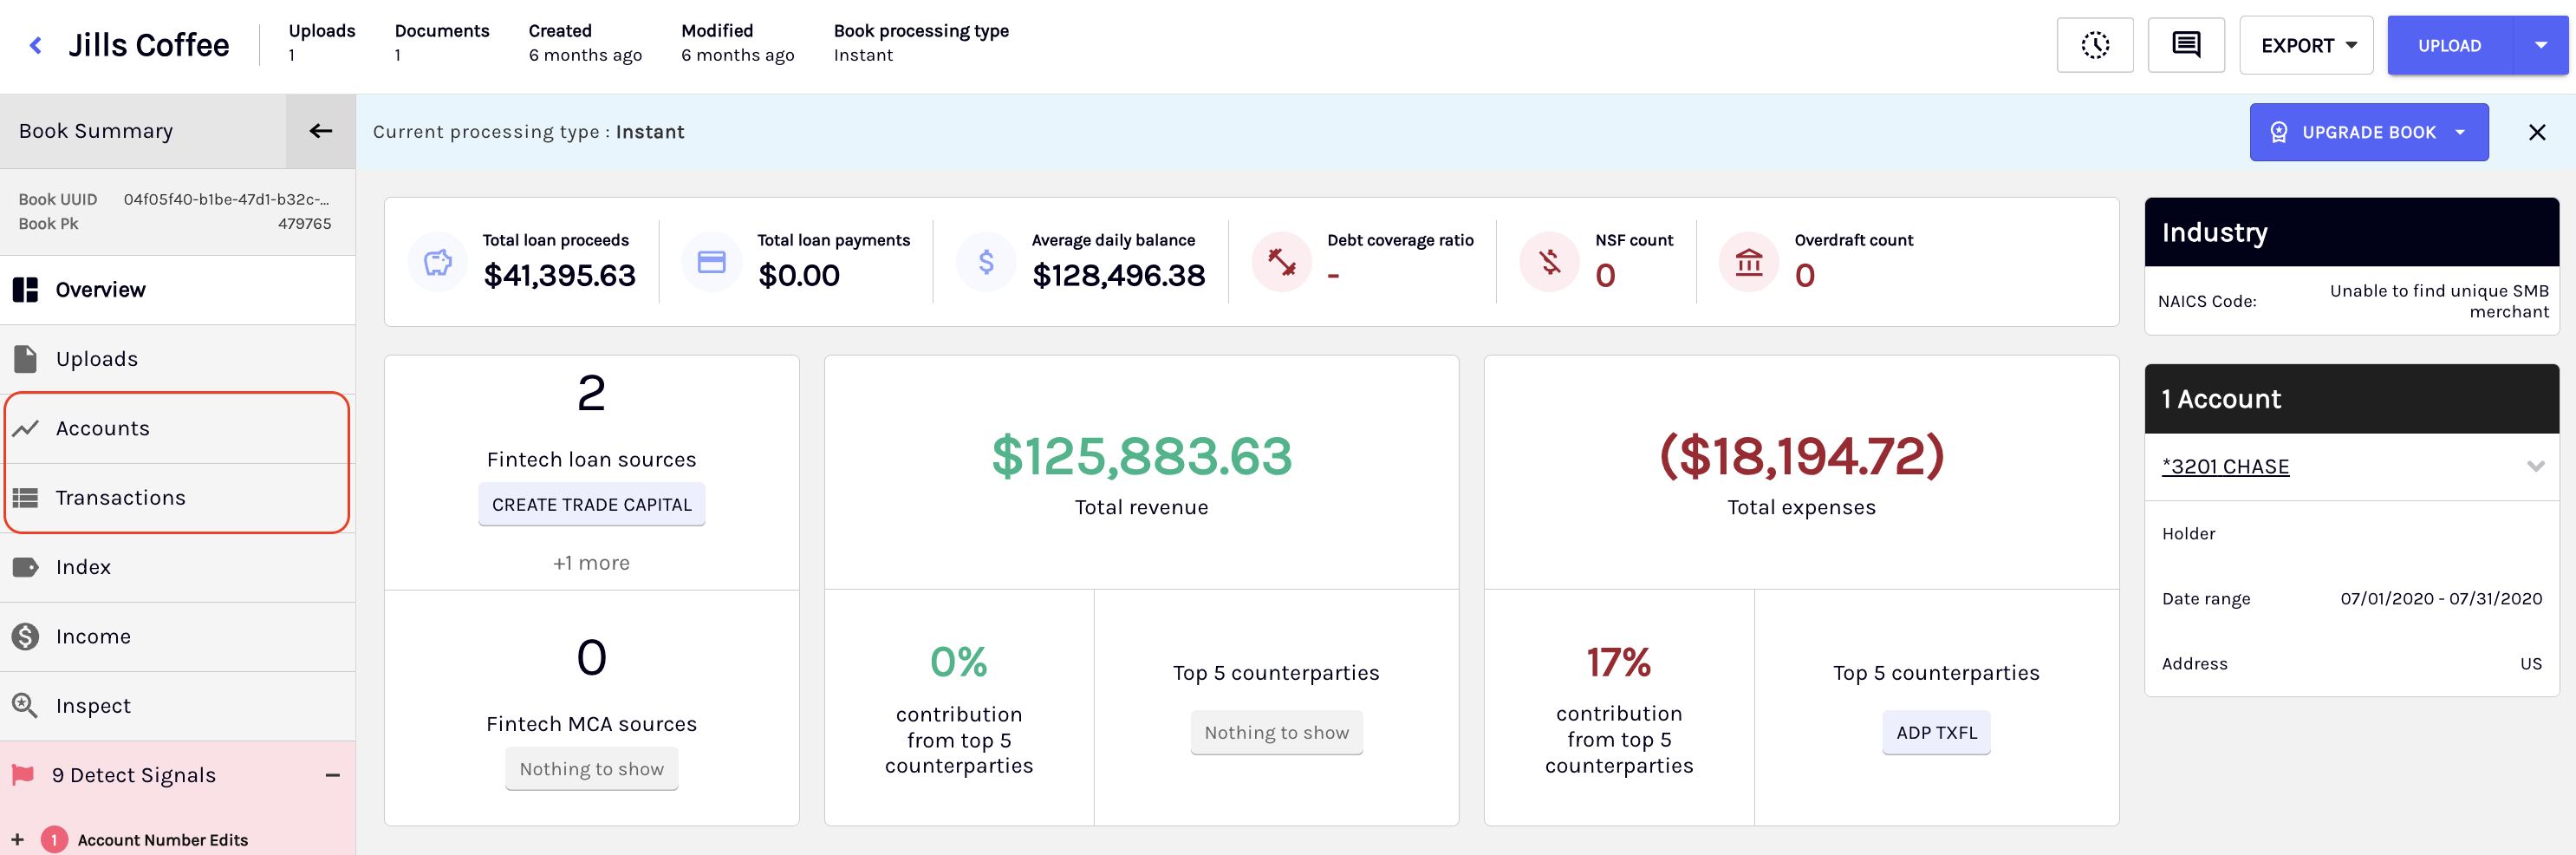
The Accounts and Transactions menus are shown on the Book Summary panel. To learn more about the details available on these pages, see the Accounts section and Transactions section.
Updated 2 months ago