
Bank statement income calculator (BSIC)
Get detailed analytics from a borrower's bank statements in Excel format.
The Bank Statement Income Calculator (BSIC) enables you to perform complete and investor-ready bank statement income analysis directly within the Ocrolus dashboard, without relying on Excel exports. This provides configurable income inputs, interactive visualizations, automated insights, and one-click PDF reporting that aligns with investor guidelines.
This guide outlines the full overview of BSIC functionality, configuration options, workflows, and outputs.
BSIC offers an end-to-end workflow for analyzing borrower income for non-QM bank statement loans using Dashboard. This includes:
- Inline editable income-driving inputs
- Organization-level underwriting defaults
- Automated trend visualizations and insights
- Missing statement and NSF/overdraft flags
- Large deposit detection and configurability
- Transaction-level filtering and insights
- Multi-account merging for aggregated analysis
- Loan-type switching
- One-click PDF export of investor-ready summaries
BSIC can fully replace Excel-based workflows to reduce errors and accelerate underwriting decisions.
TipTo use the BSIC, ensure that you have an active Ocrolus Dashboard user profile. If you need access to the Ocrolus Dashboard, please contact your account manager.
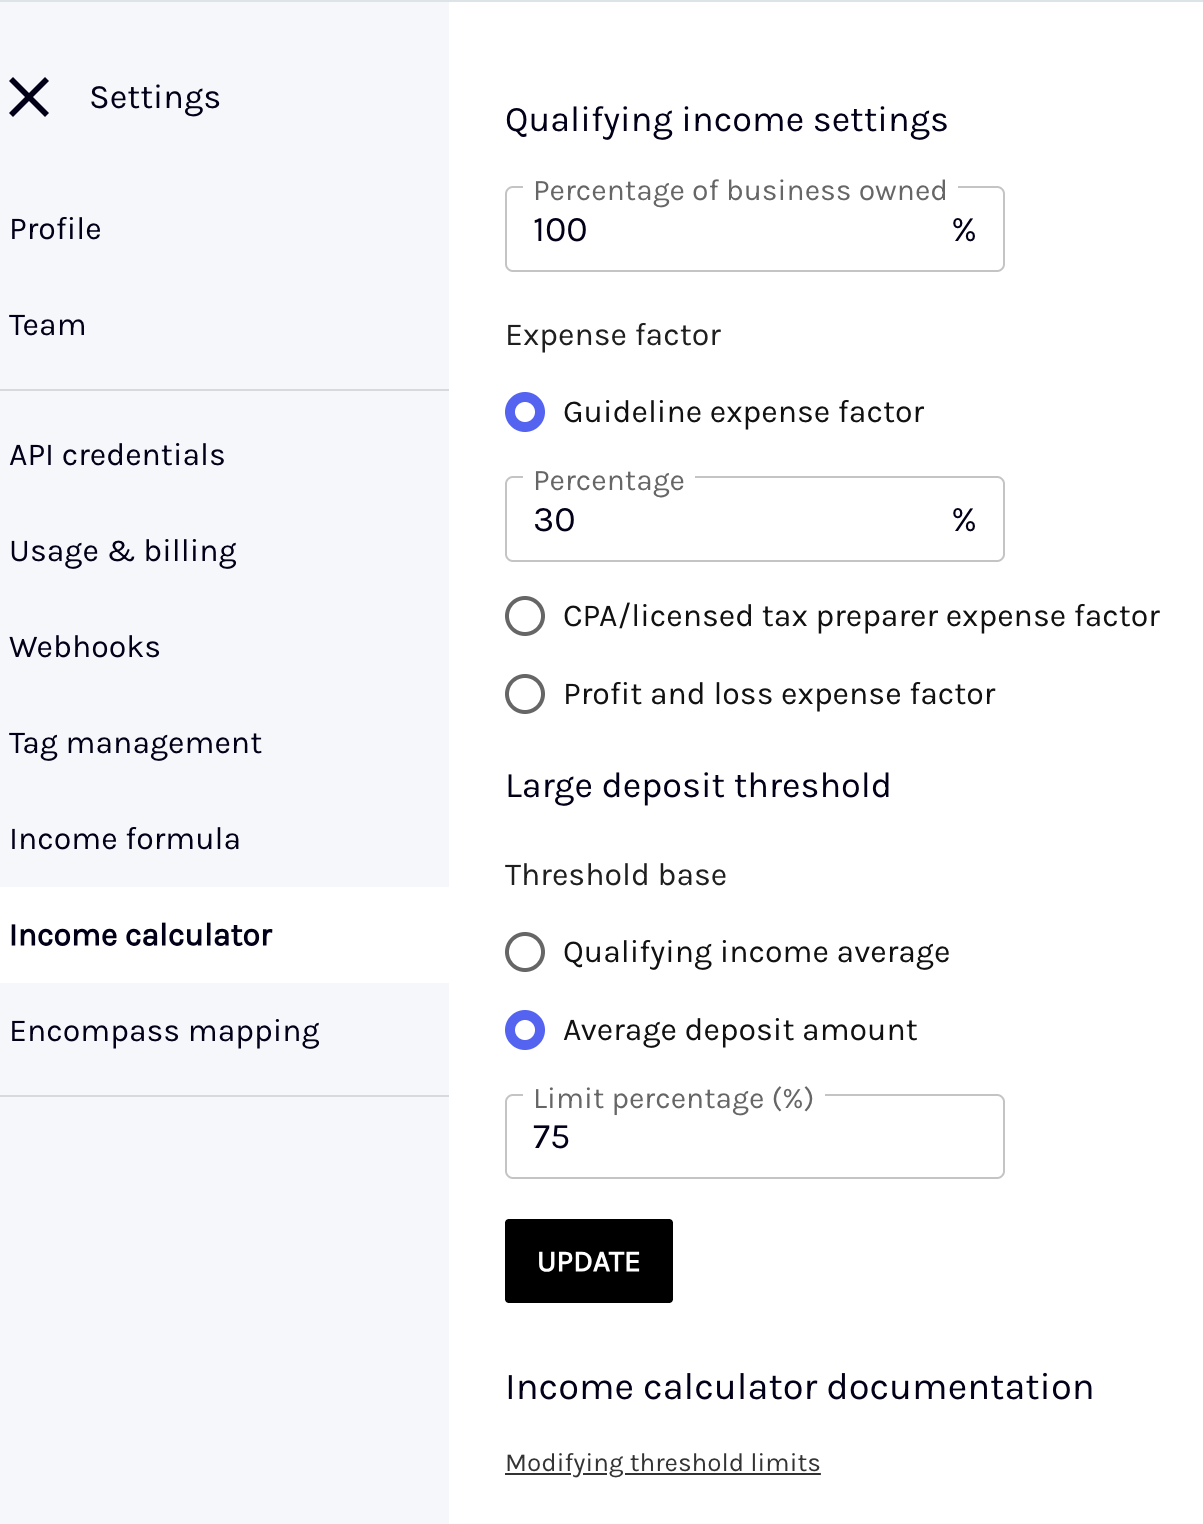
Configurable income inputs
You can configure all key income drivers directly within the Dashboard, removing the need to adjust values in Excel.
Editable input
The following inputs can be edited at the Book level or pre-set as organization-level defaults:
| Input | Description |
|---|---|
| Expense Factor (%) | Guideline percentage applied to deposits to estimate income after expenses. |
| % Business Ownership | Borrower's ownership percentage for business accounts. This is configured at the Book-level only and can be applied to multiple accounts at the same time. The value is included in the PDF report export. |
| Large Deposit Threshold | Rules used to identify large deposits. The threshold can be set as a percentage of a chosen baseline and can exceed 100%. for example, 200% of average deposit. You can also configure a specific dollar amount threshold at the Book-level, with up to two decimal points of precision such as $5,000.50. |
| Account Type | Designate an account as Business or Personal to ensure correct income logic. |
As you modify these values, qualifying income recalculates in real time. Monthly averages update automatically as inputs change, and income adjusts dynamically when transactions are manually included or excluded.
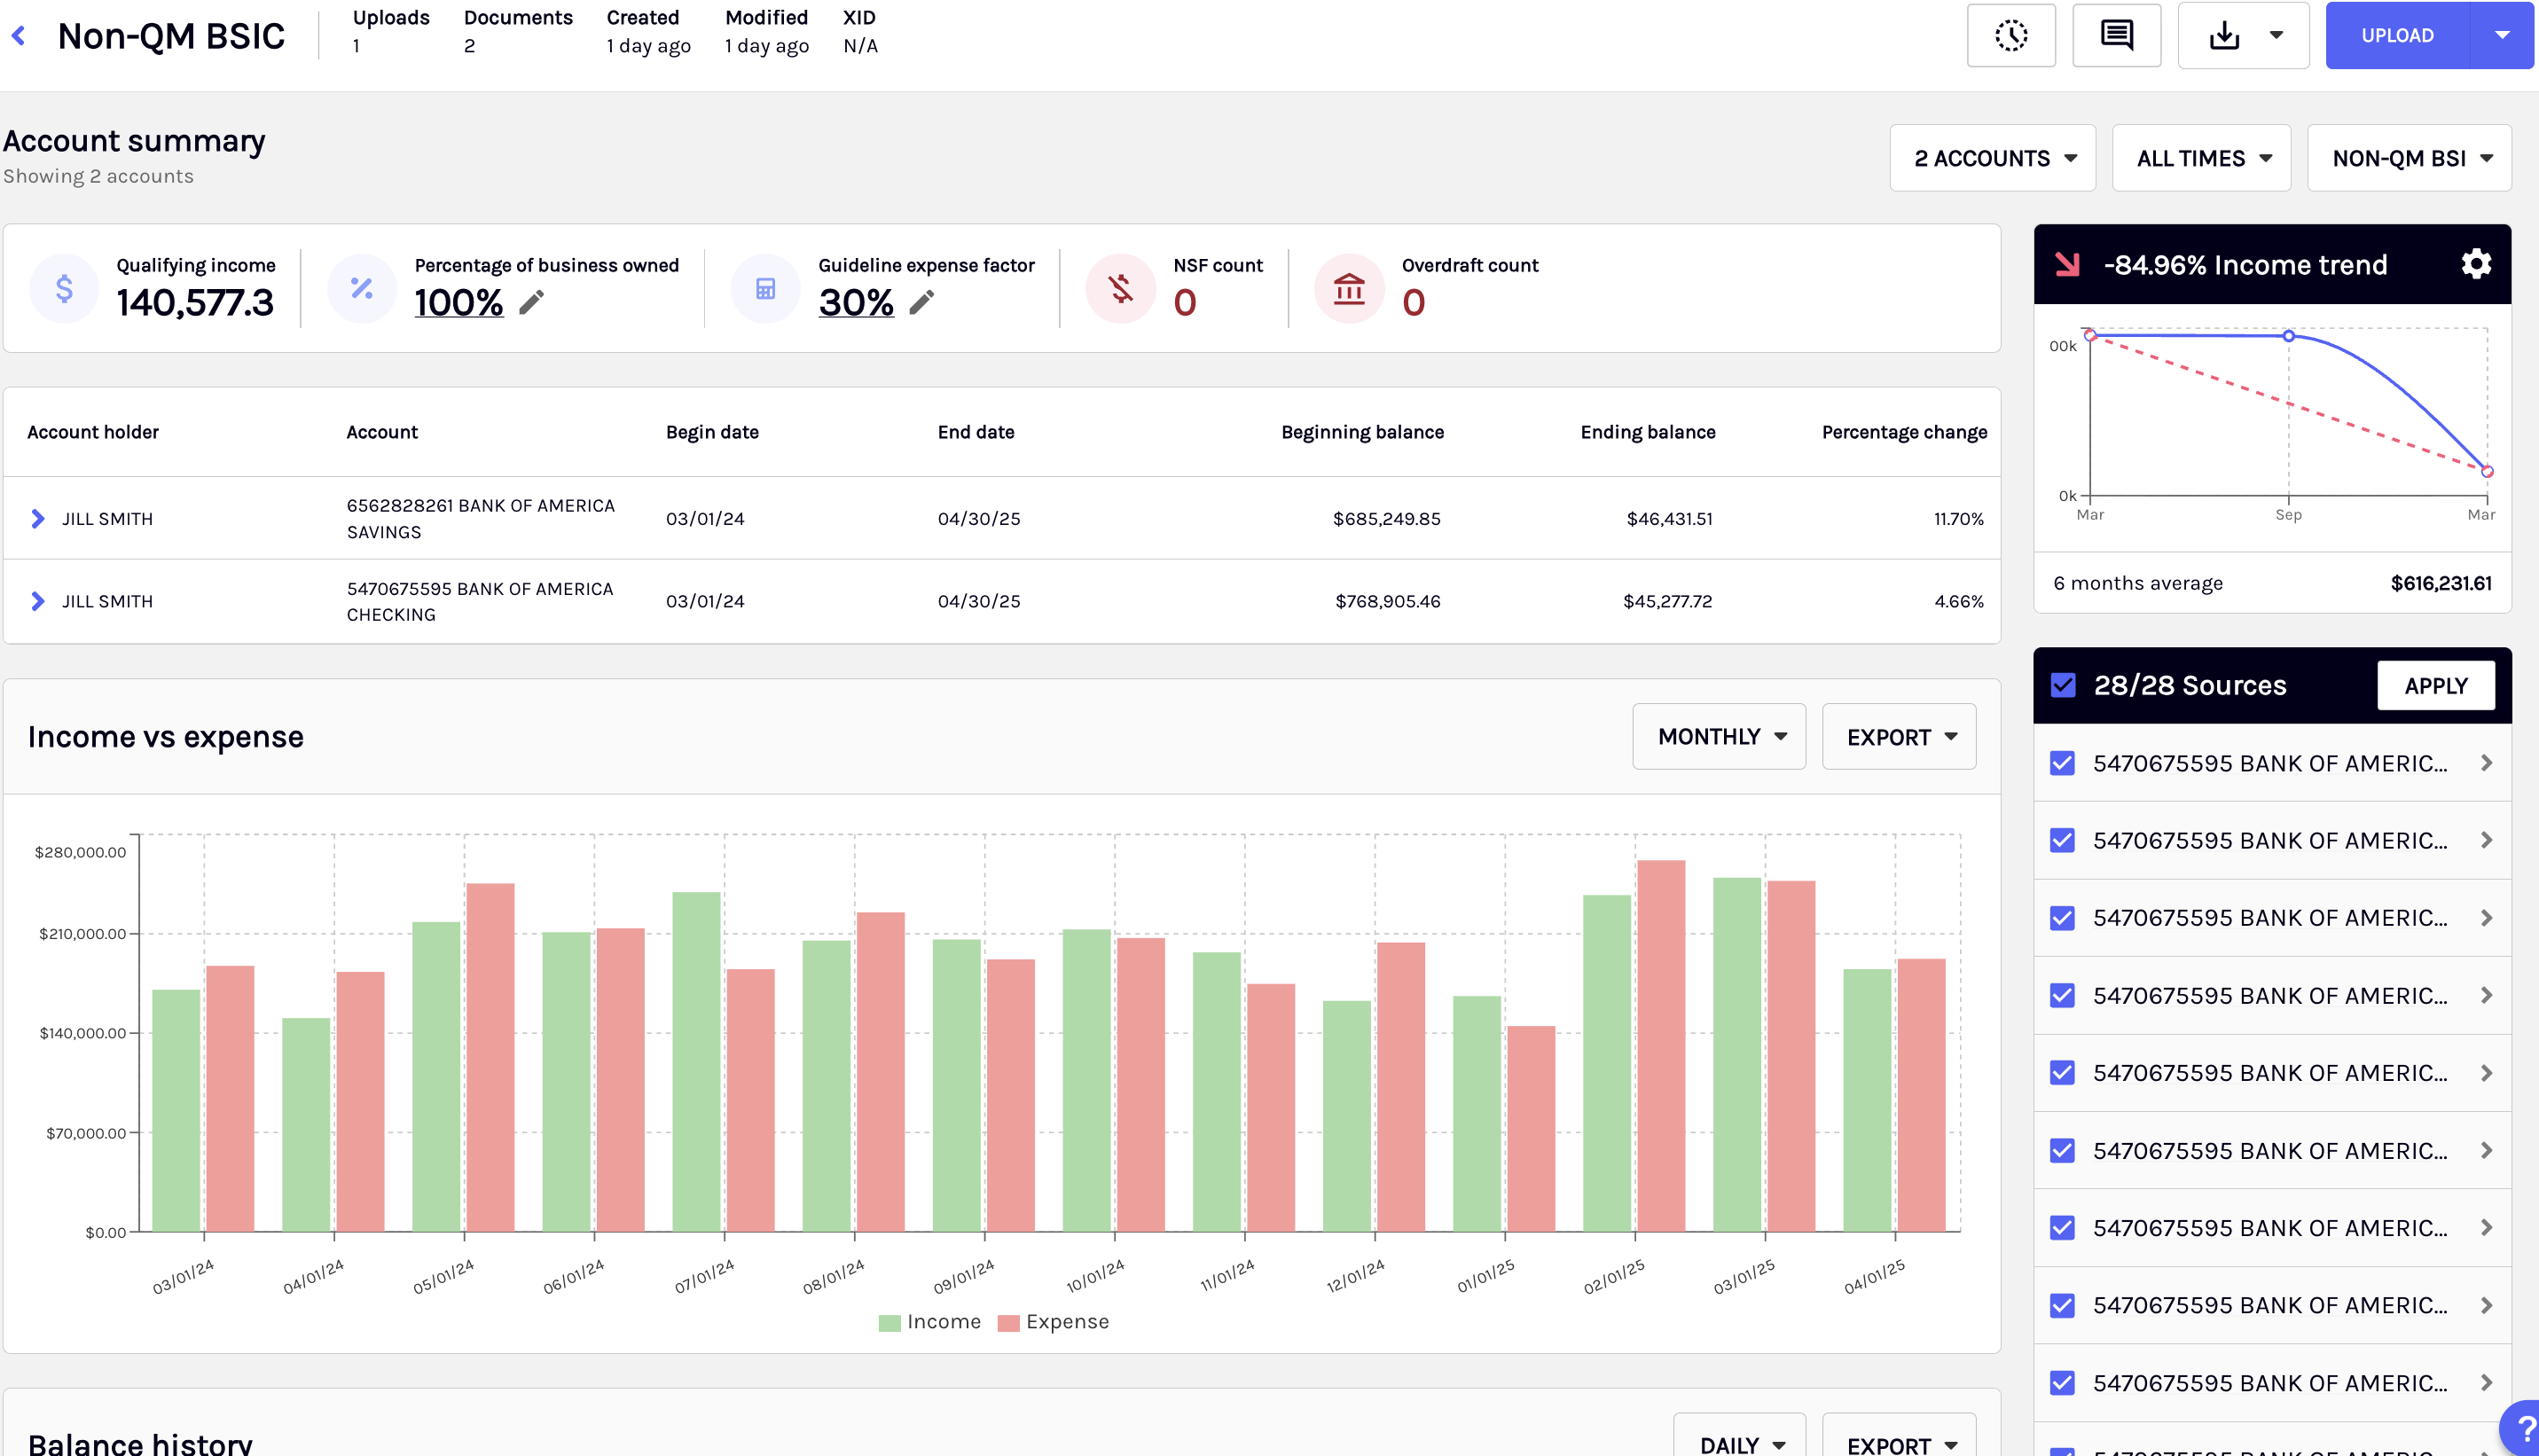
Income visualization
Income visualization helps you quickly identify income patterns, growth trends, and potential red flags within borrower cash flow. BSIC provides multiple trend views and account-level insights to support faster, more confident underwriting.
| Category | Details |
|---|---|
| Trend Visualizations | - Monthly trend chart - Quarterly trend chart - Six-month trend chart (default) |
| Color Logic | Green = positive growth Red = negative trend |
| Growth Insights | % growth or decline across the selected period |
| Depositor Analysis | Top 10 depositors with total deposit amounts |
| Qualifying Income Summary | Account-level summary of qualifying income |
| Deposit Totals | - Total deposits - Included deposits - Excluded deposits |
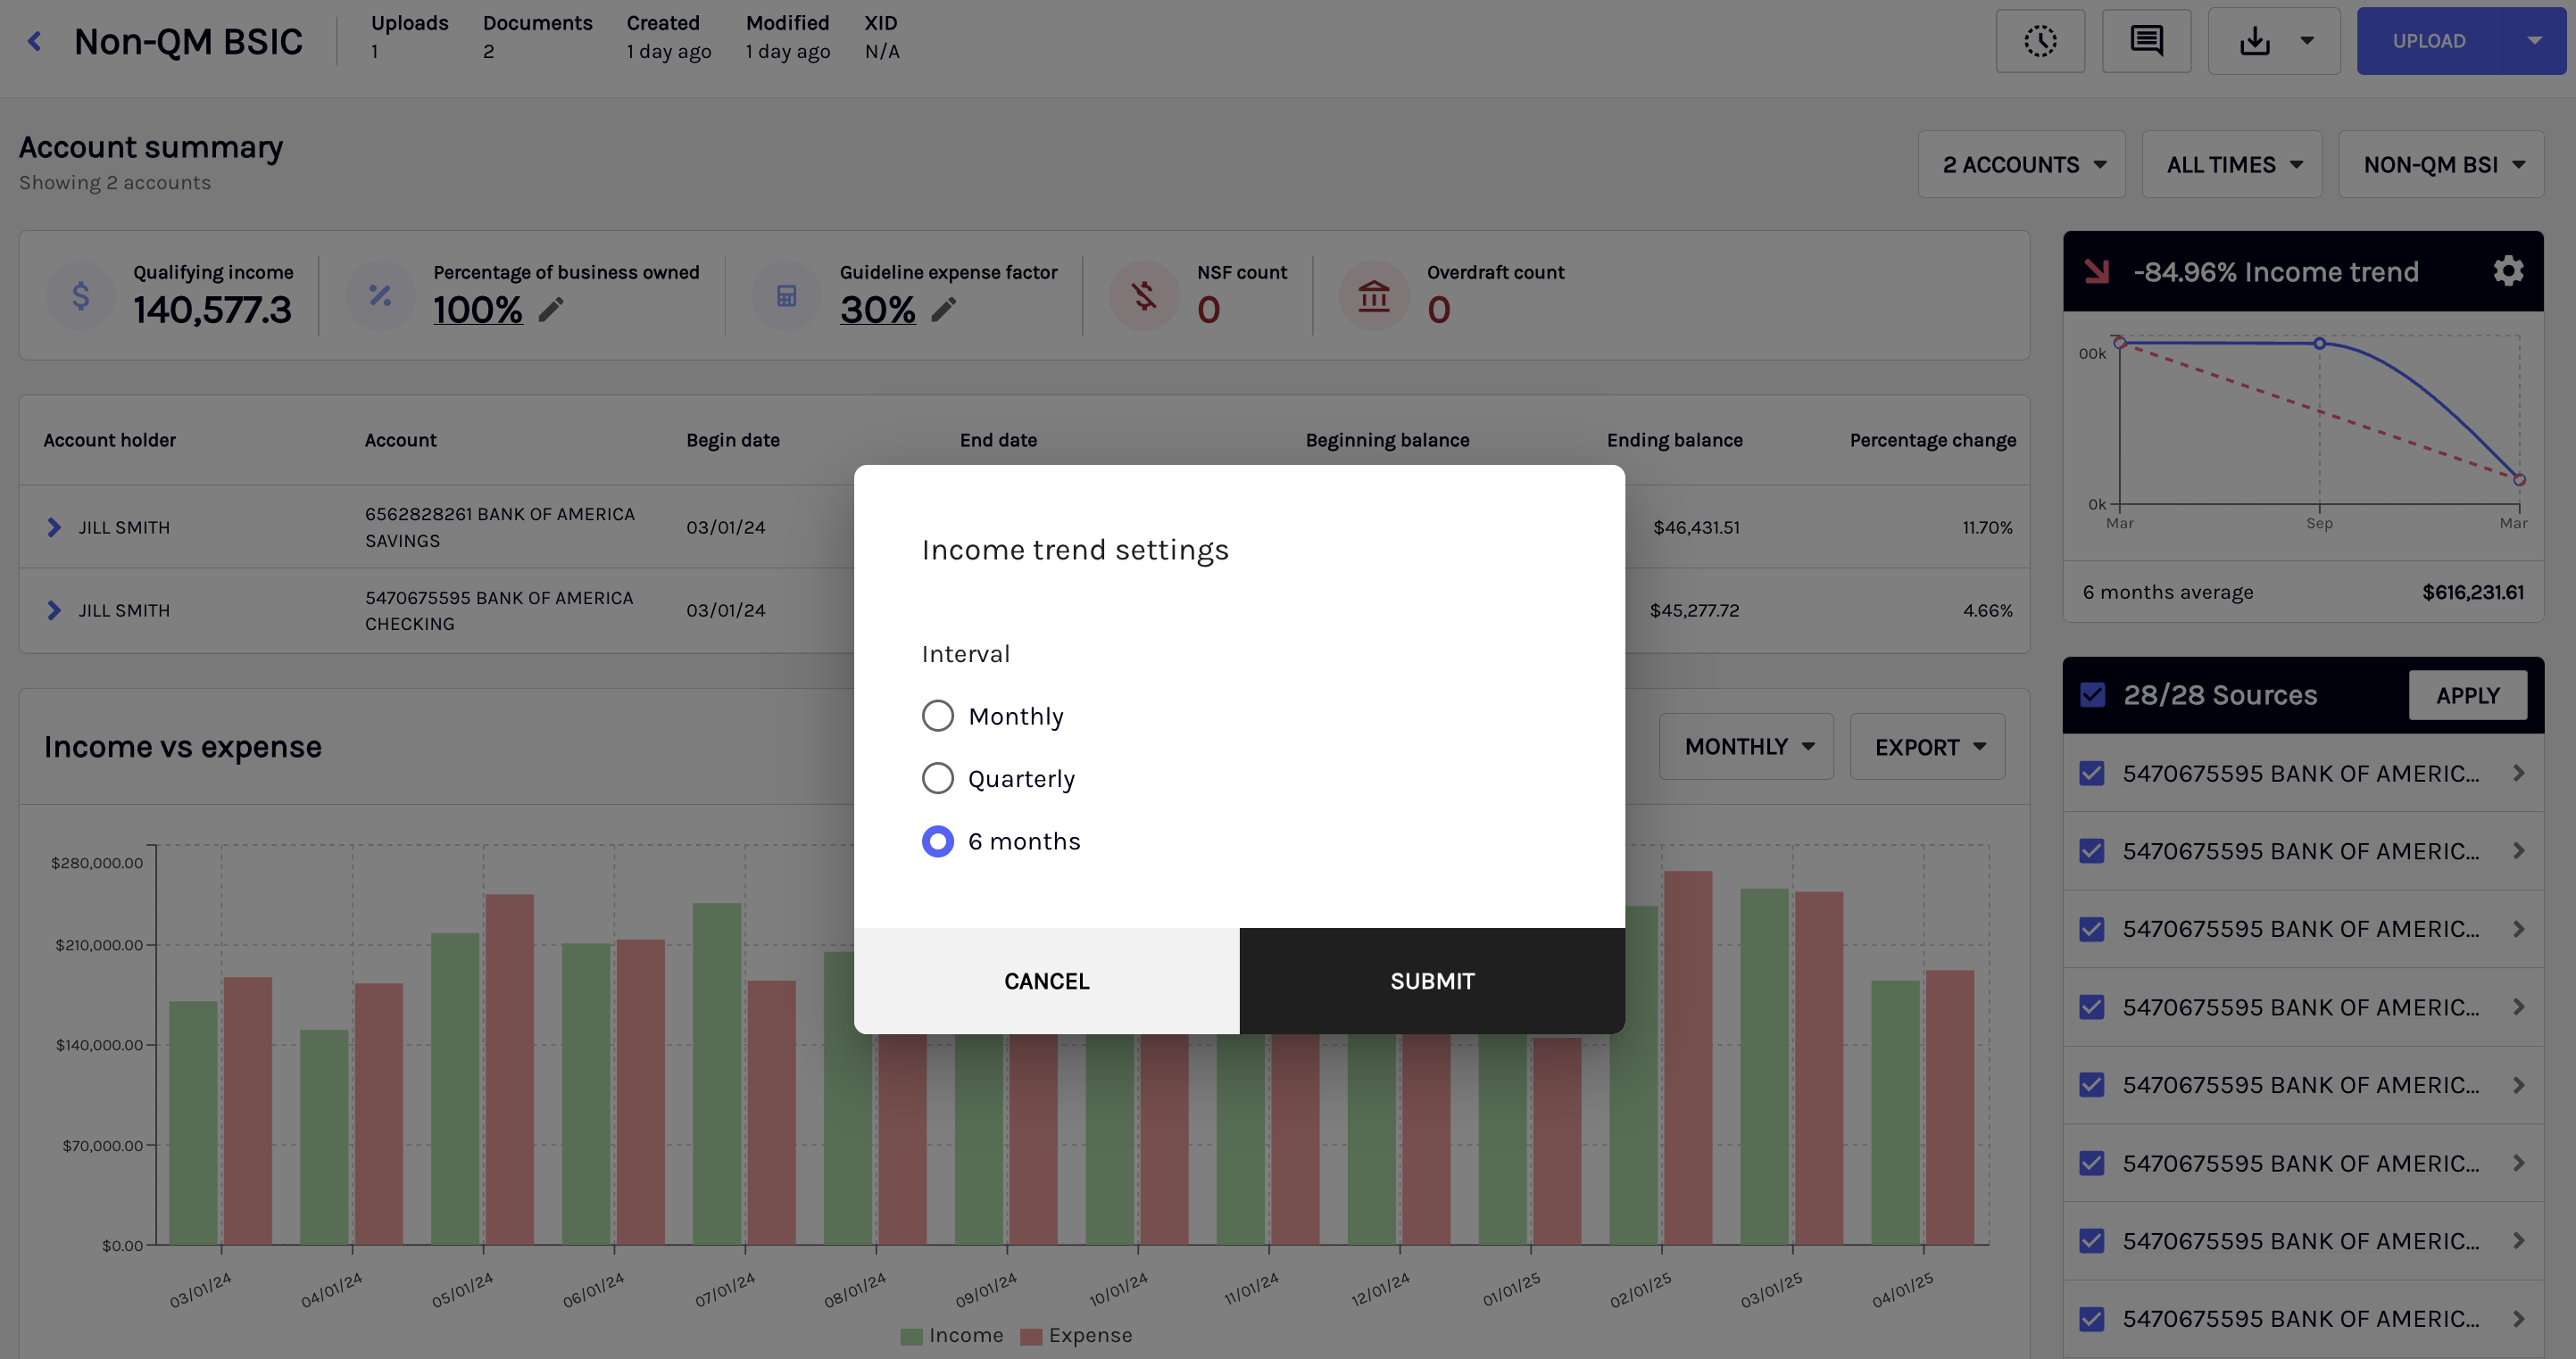
Income trend settings
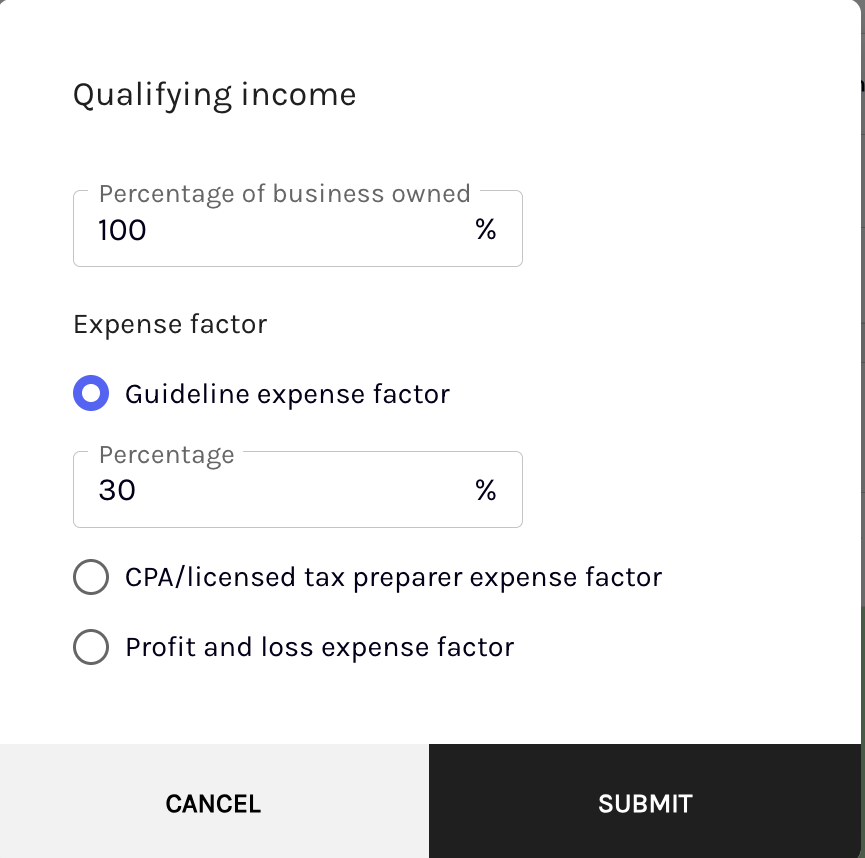
Qualifying income
NSF/Overdraft and statement completeness
BSIC automatically highlights cash-flow risk indicators such as NSF events, overdraft days, and missing monthly statements by detecting gaps or anomalies in account activity. These insights appear in both the Dashboard and PDF export to help you quickly verify completeness and identify potential issues.
NSF/Overdraft flags
BSIC automatically detects and displays:
- The number of NSF (non-sufficient funds) events
- The number of days with overdraft fees
These indicators appear both in the Dashboard and in the PDF export to quickly spot cash-flow risk factors.
Missing statement detection
BSIC identifies potential gaps in statement coverage by detecting breaks in an otherwise consecutive sequence of monthly statements.
For example, if the system detects statements for December 2022 and February 2023, but not January 2023, BSIC flags “Missing: Jan 2023 for [Account Name]”. This helps you verify statement completeness and quickly identify missing documentation.
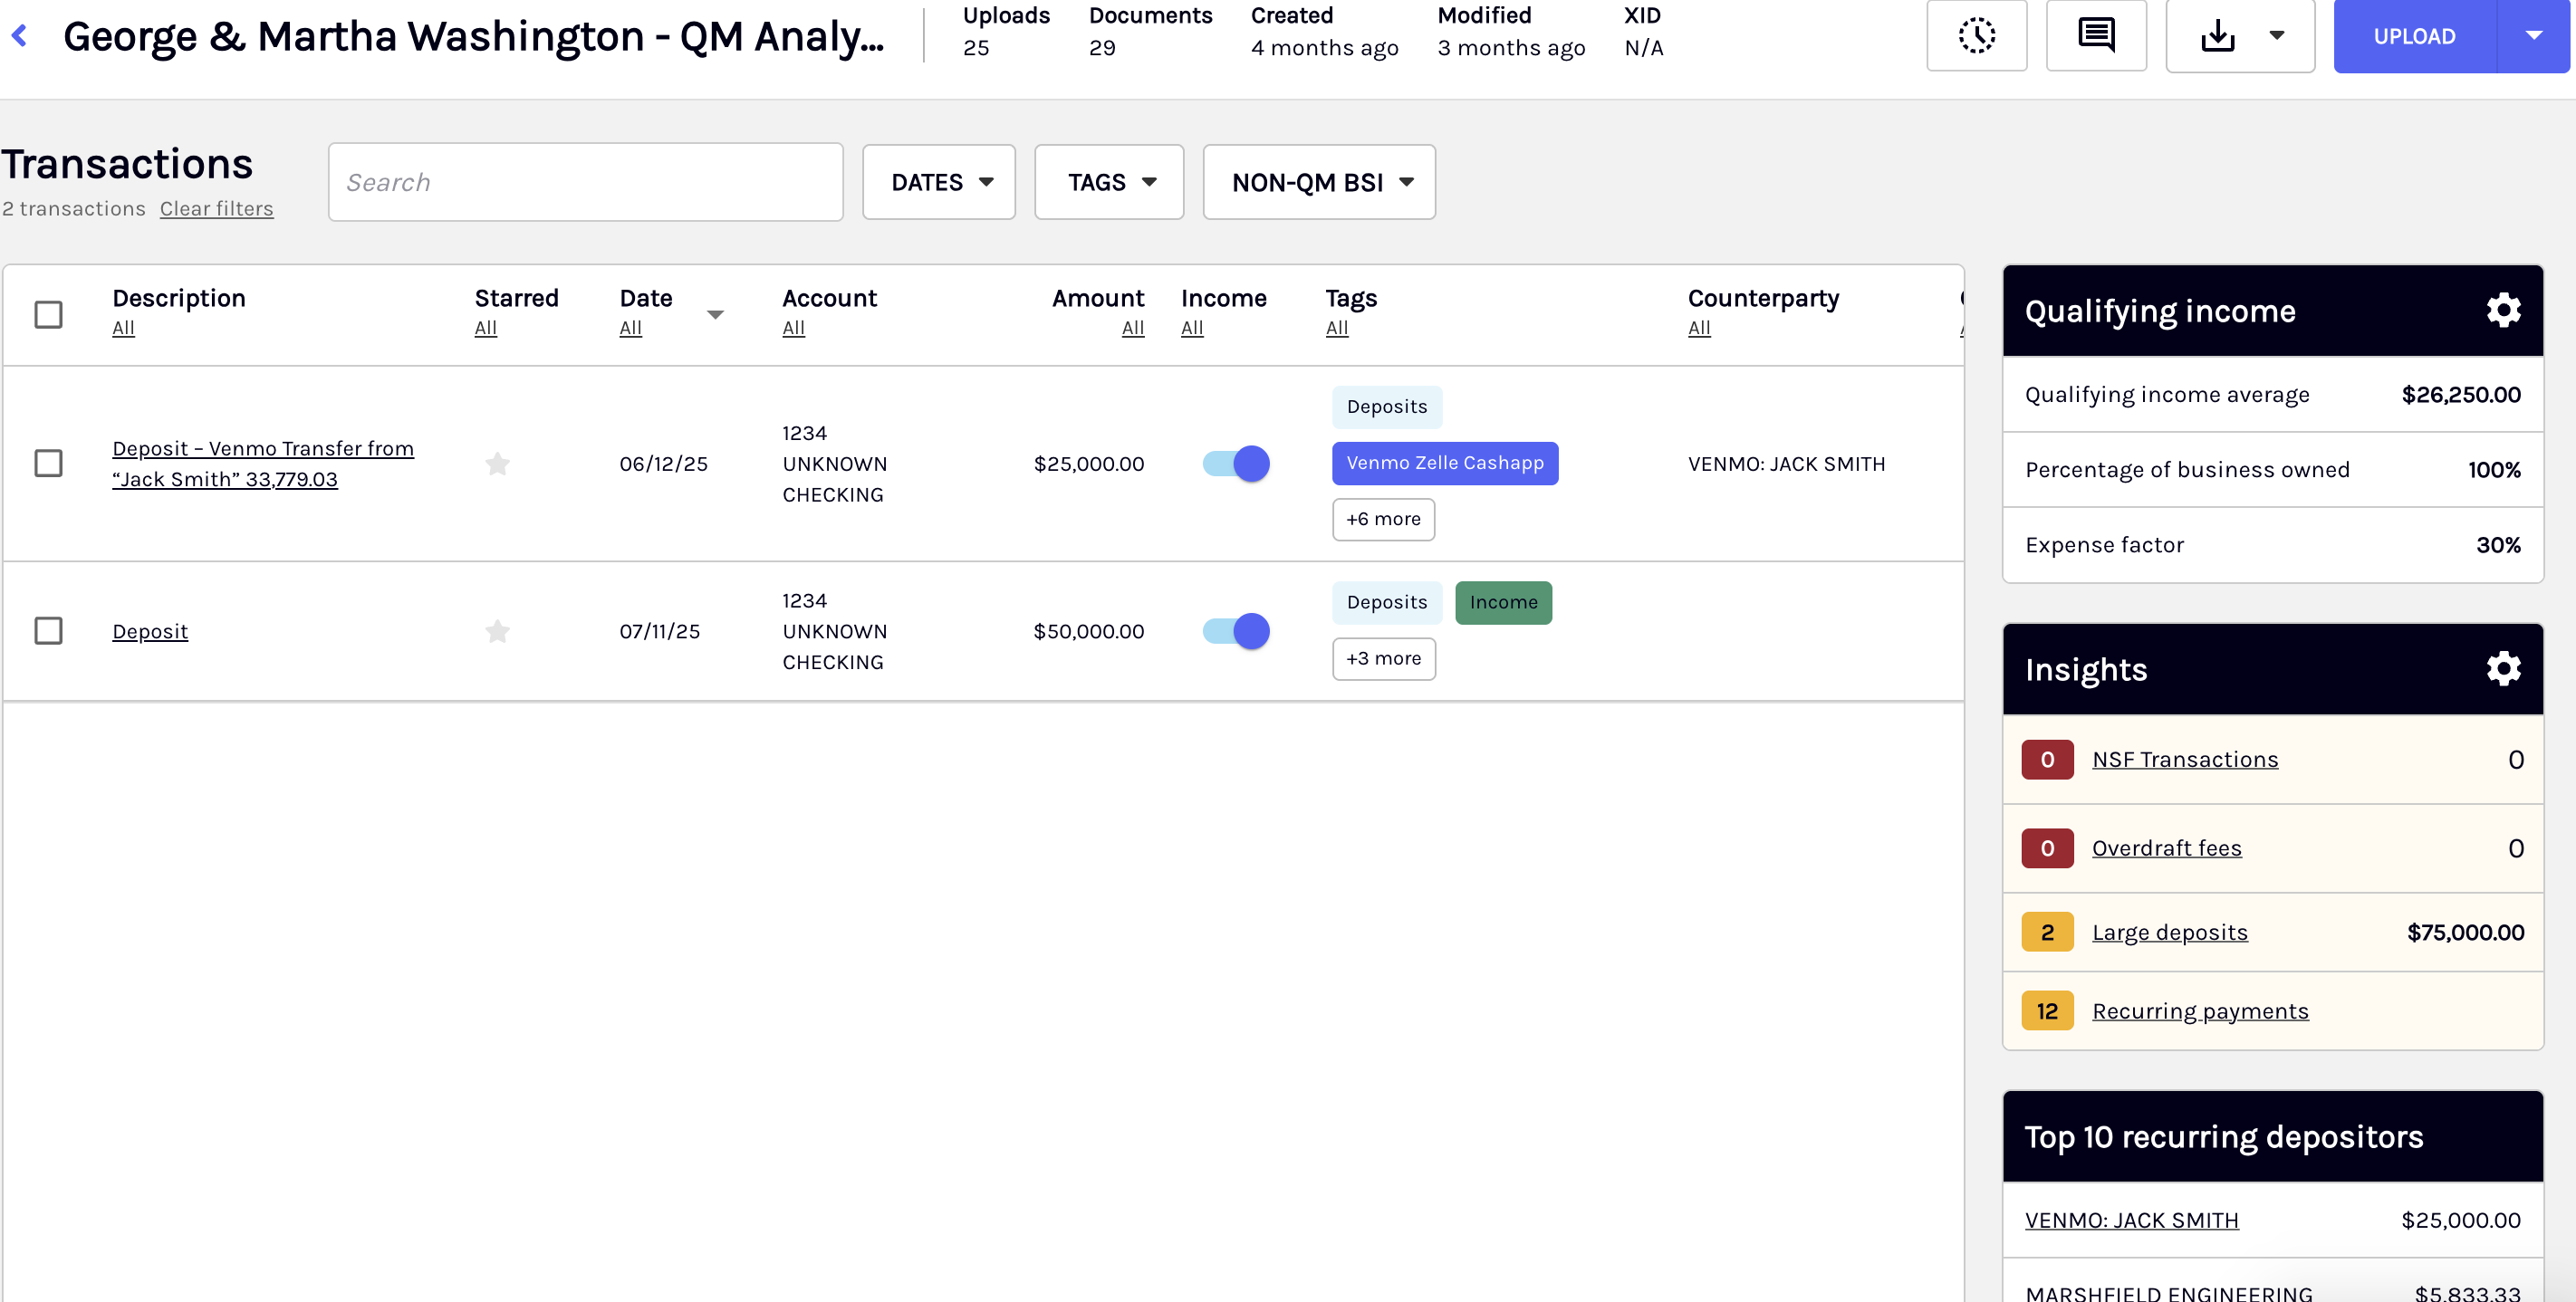
Transactions insights and quick filtering
You can quickly filter the transactions table by selecting insight categories displayed above the table. These insights help you navigate directly to key transaction patterns without manually searching.
| Insight Filter | Description |
|---|---|
| NSF Transactions | Filters to show only NSF-related transactions. |
| Overdraft Fees | Displays transactions associated with overdraft fee charges. |
| Large Deposits | Highlights deposits flagged as unusually large. |
| Recurring Payments | Shows recurring or patterned payment activity. |
When you select an insight, the table filters to show only the relevant transaction types. You can clear the filter at any time to return to the full transaction list.
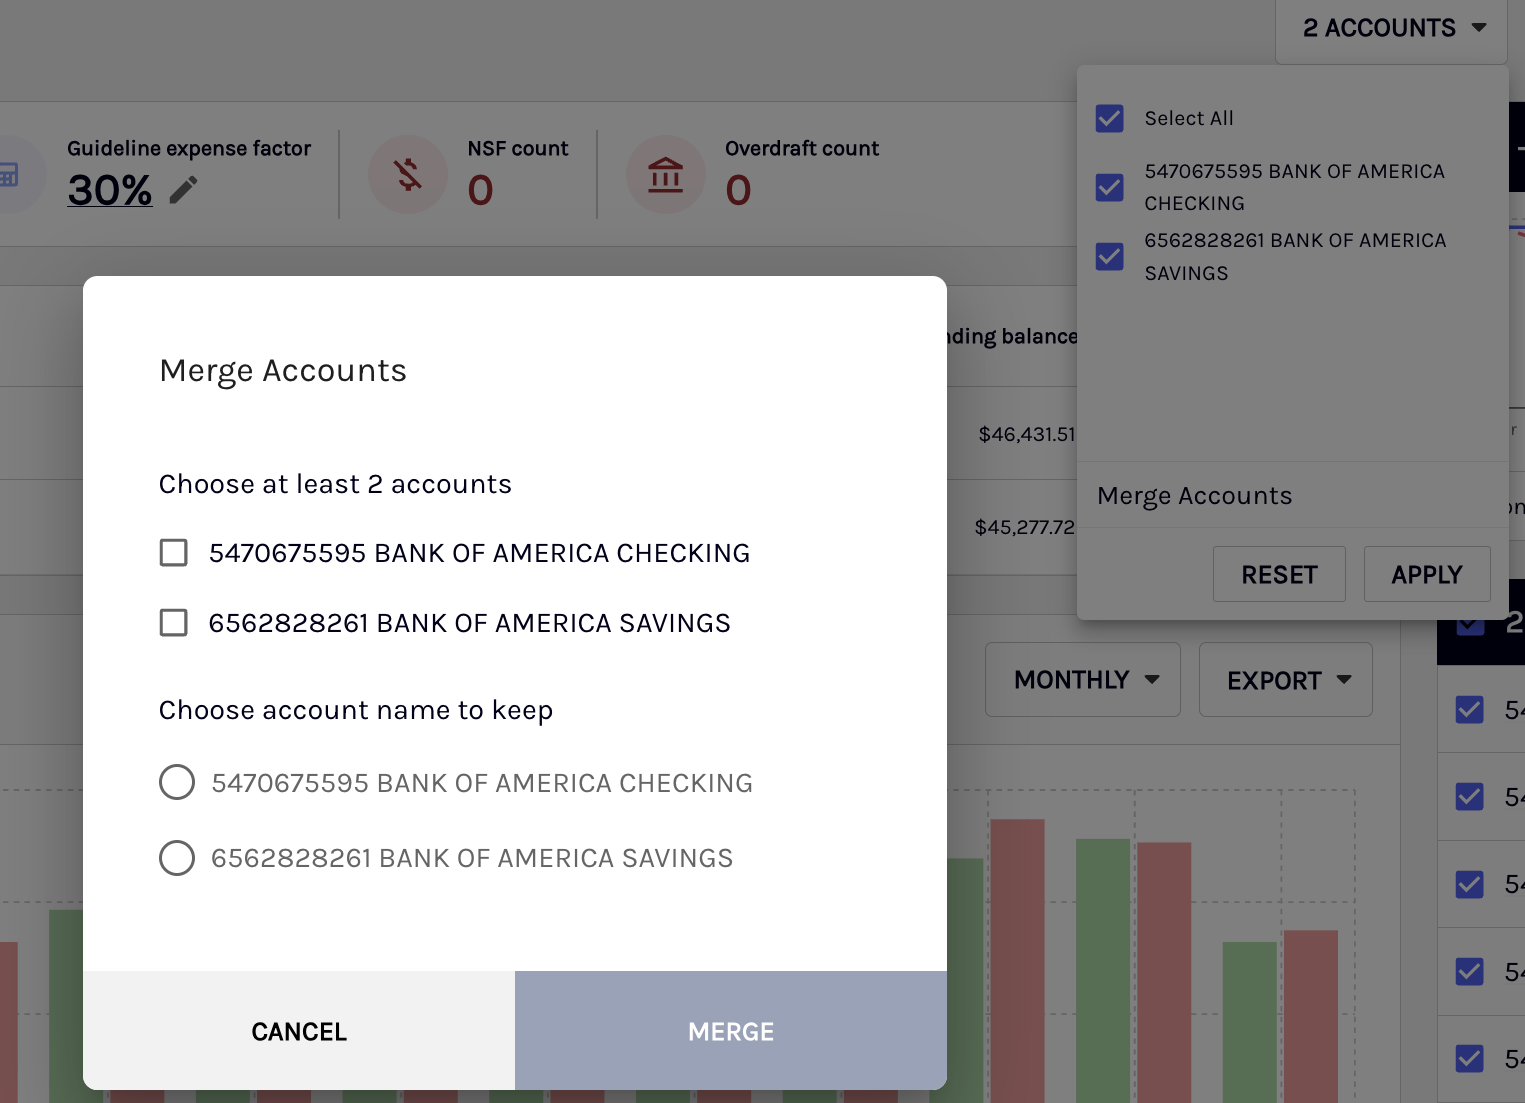
Merging accounts
When you receive statements that logically belong together, for example, multiple accounts for the same business, you can merge them in BSIC to generate a unified income analysis. This helps you view consolidated income trends and eliminates the need to analyze related accounts separately.
To merge the accounts, perform the following steps:
- Select Merge Accounts.
- Multi-select the accounts you want to combine.
- Choose which account name you want to retain.
- BSIC regenerates analytics using the merged statements.
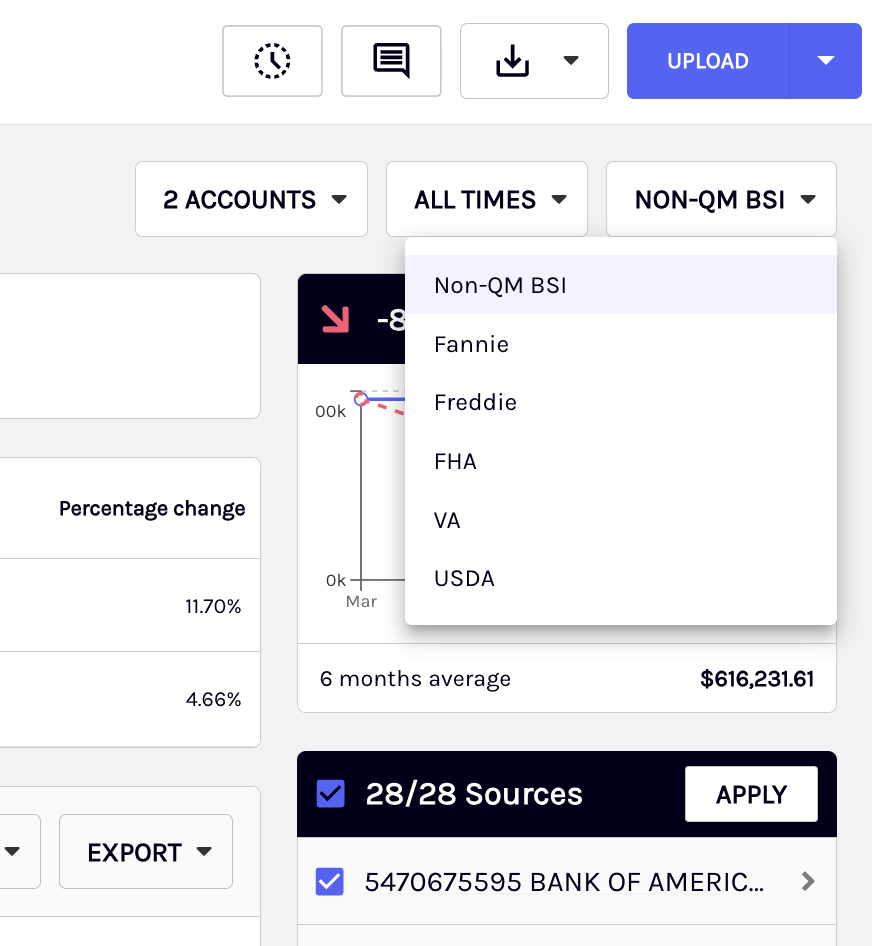
Loan type dropdown
The Dashboard supports multiple loan programs. Selecting a non-BSIC loan type hides BSIC-specific information and displays the standard account summary. You can switch views depending on the loan being underwritten.
The available loan types are:
- Non-QM BSI
- Fannie Mae
- Freddie Mac
- FHA
- VA
- USDA
PDF report export
You can generate an investor-ready PDF report for secondary market review or internal documentation. The export provides a complete summary of borrower inputs, income calculations, and key analytical insights.
PDF Report Contents
| Category | Details included |
|---|---|
| Borrower Inputs | Selected income factors, % business ownership, expense factor, and factor type (Standard, P&L, CDA, etc.) |
| Qualifying Income | Monthly qualifying income; entity-level breakdowns |
| Income Trends | Trend direction and percentage change |
| Risk Indicators | NSF count, overdraft count |
| Deposit Insights | Number of large deposits; totals for all, included, and excluded deposits |
| Excluded Deposits | Table showing date, description, and amount |
| Account Details | Account numbers and entity grouping |
Organization-level configuration
Admins can pre-configure default underwriting inputs to support investor overlays and promote consistent loan production across the organization.
Org defaults include
- Expense factor
- Large deposit threshold method
These values can be overridden at the Book level when needed.
Transactions table view customization
You can customize the transactions table by choosing which columns appear and adjusting their left-to-right order using the column arrows.
Your selections are saved at the user level, and these settings persist across all Books you open.
Generate income calculator
Generate the income calculator by accessing either the EXPORT menu or the table within the Book details page. Both options allow for a streamlined and efficient way to produce the calculator, to ensure you have the necessary data for accurate income analysis.
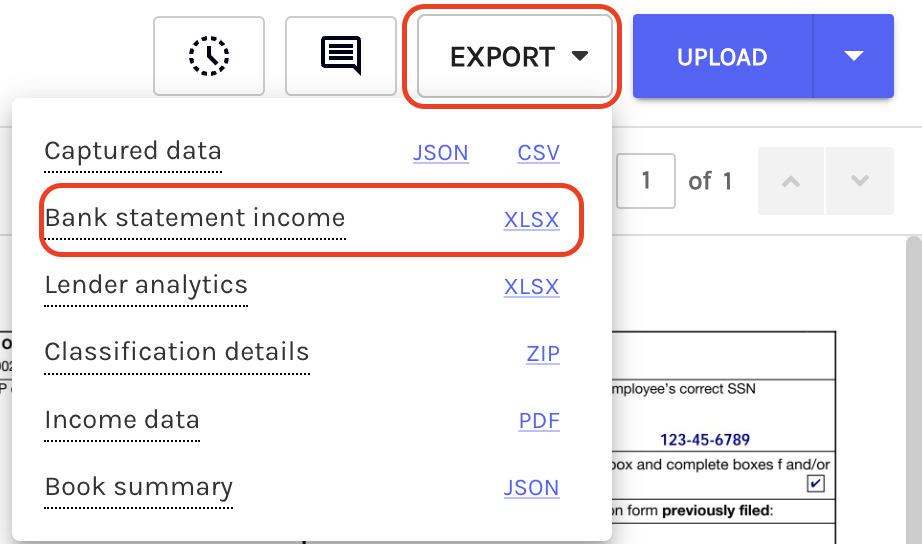
Using EXPORT menu
To generate the income calculator using the EXPORT menu, perform the following steps:
-
On the Book list page, click the Book for which you want to generate an income calculator. To find a specific Book, use the search bar.
-
Click on the EXPORT dropdown menu and select the XLSX link with the Bank Statement Income option from the dropdown menu. The income calculator for the selected Book is generated in the XLSX format.
Using Book details page
To generate the income calculator using the Book details page, perform the following steps:
-
On the Book list page, click on the ellipses menu on the right-hand side of the Book from which you'd like to generate an income calculator.
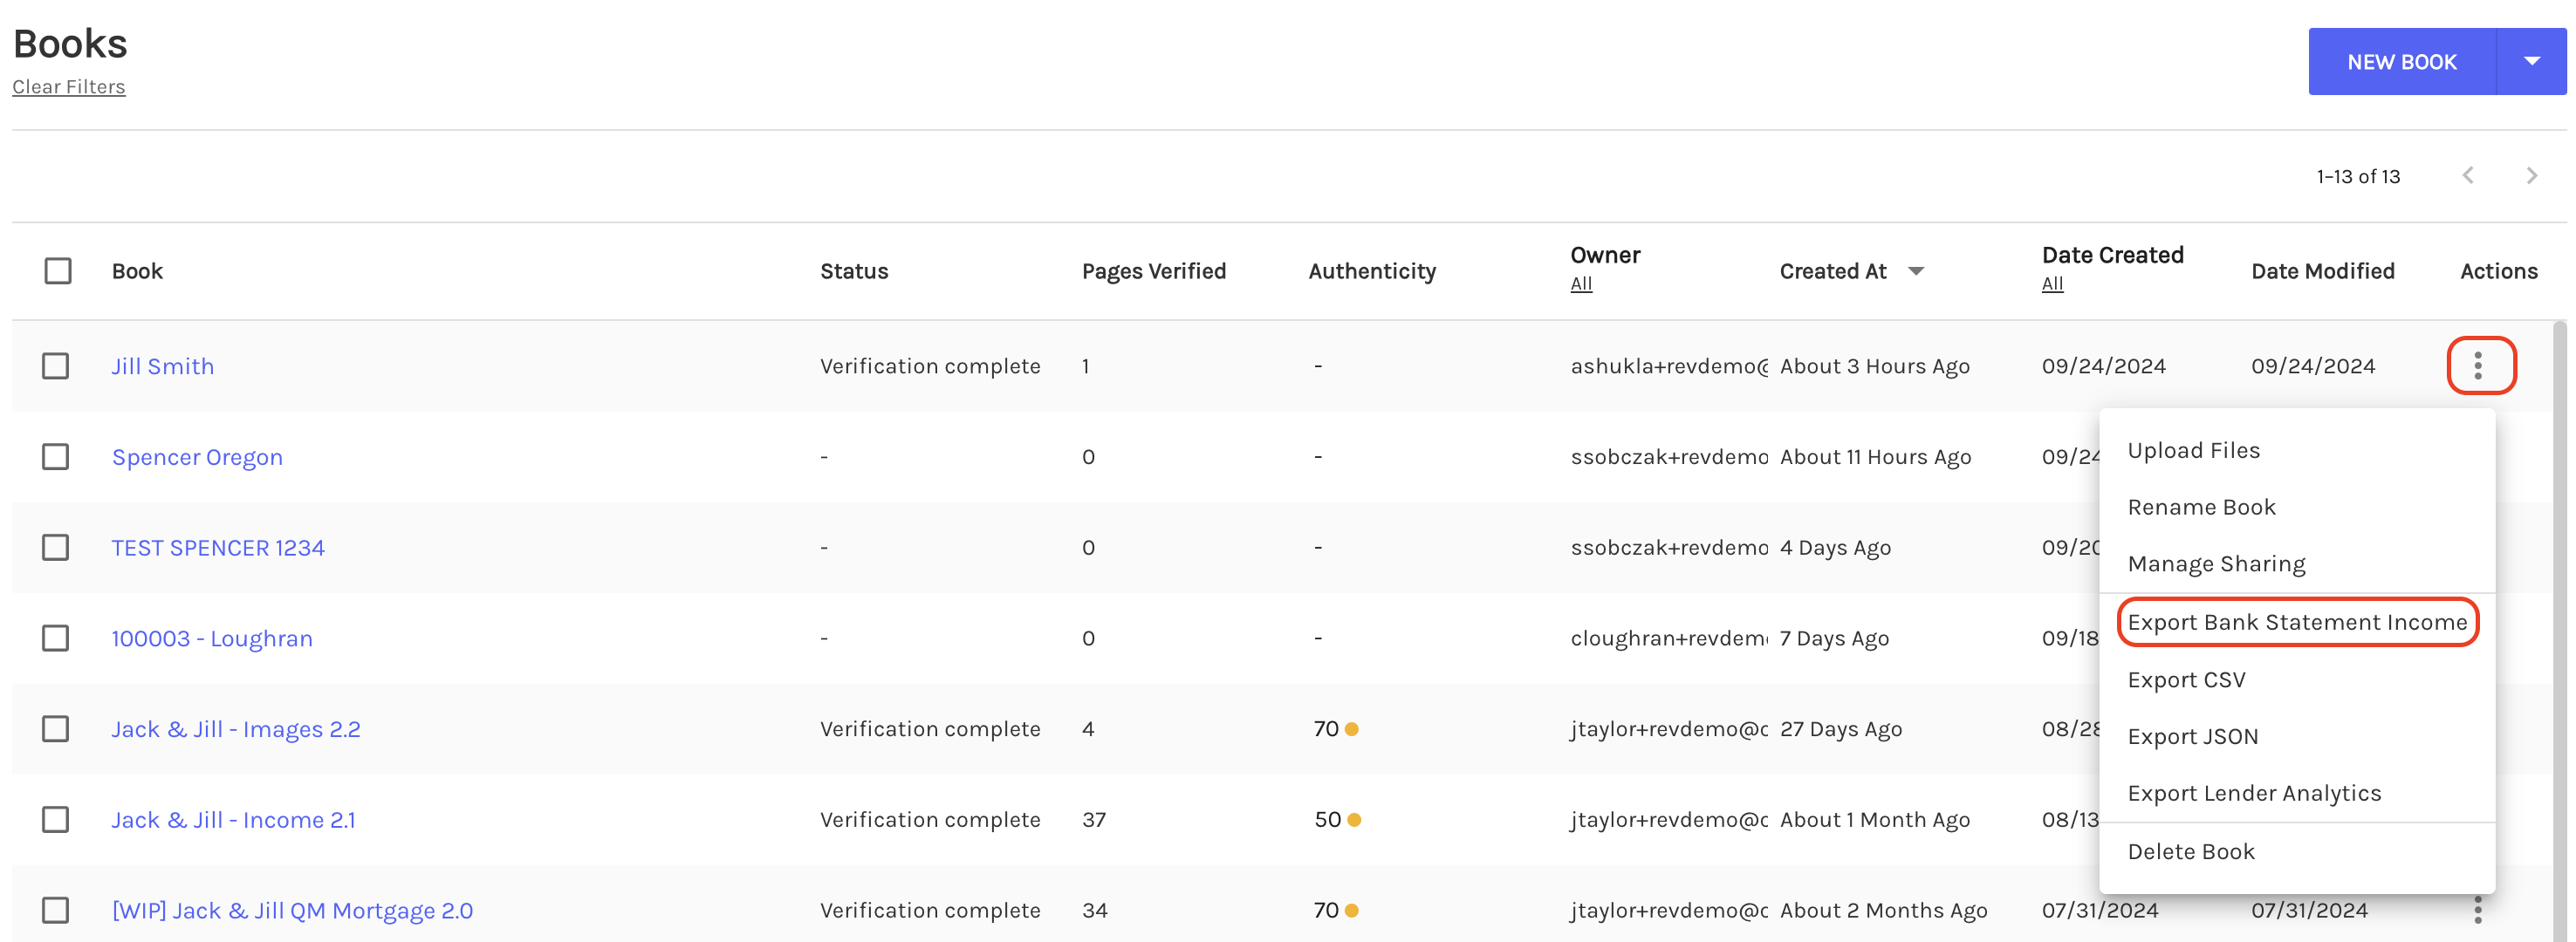
-
The income calculator for the selected Book is generated in the XLSX format.
Inspecting the Excel output
The spreadsheet is organized across two tabs: Book Summary and Account Summary. Each tab is designed to support a different level of analysis. The Book Summary tab provides a high-level consolidated view across all accounts, while the Account Summary tab offers a deeper, account-level breakdown to help you identify income trends, recurring depositors, and cash flow risk indicators.
Together, both tabs cover deposits, statement overview, NSF transactions, overdraft activity, large deposit thresholds, recurring expenses, and borrower information. This gives you a complete view of each transaction detail and how qualifying income is determined across all uploaded bank accounts.
Some fields in the spreadsheet are tagged as Add data here. It indicate fields that require manual entry from the end user, such as borrower name, loan number, and expense factor inputs.
Book Summary tab
The Book Summary tab in the BSIC spreadsheet provides a comprehensive and structured overview of income-related data across all uploaded bank accounts. It is designed to offer a clear and concise summary of key financial details, making it easier to analyze and verify income calculations.
Instead of manually reviewing individual bank statements, you can rely on this summary to gain a holistic view of financial data. The Book Summary tab also includes a Print to PDF functionality to allow you to quickly generate a PDF version of the summary.
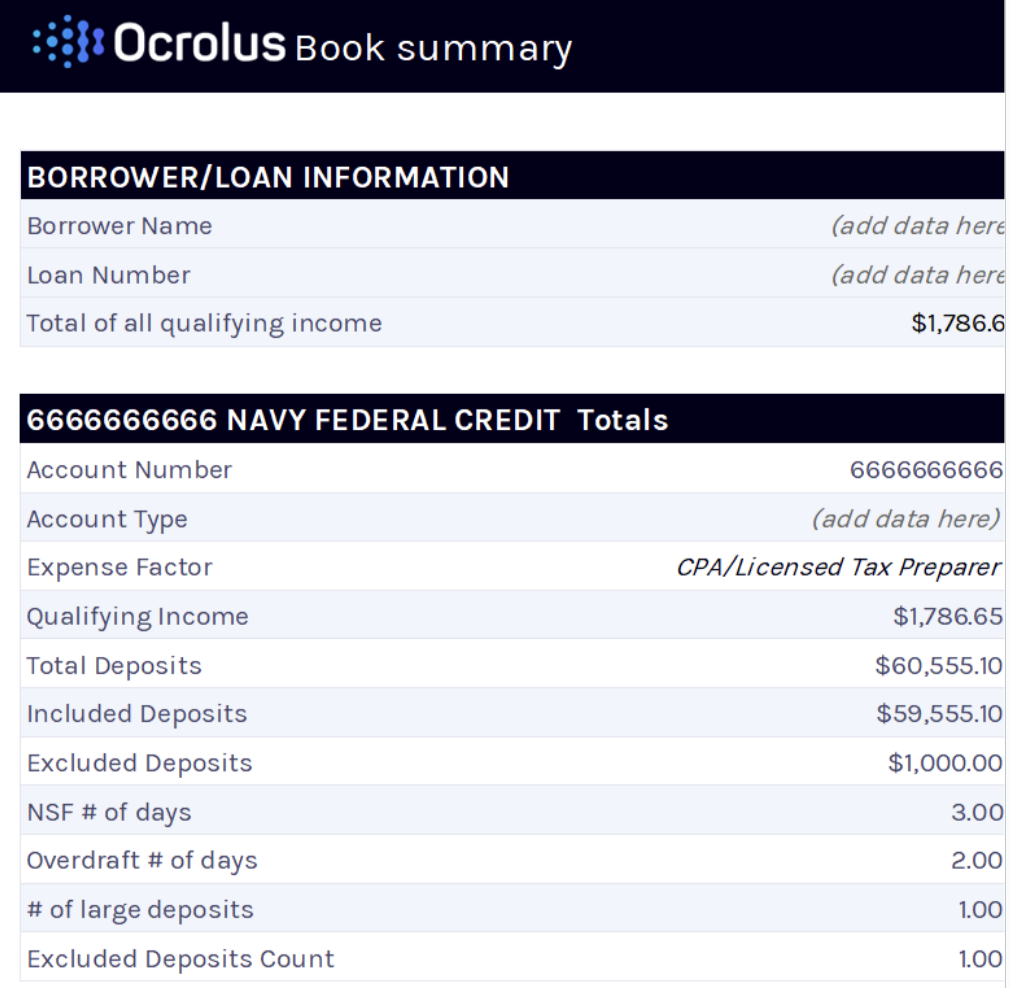
Borrower/loan information table
This table provides a consolidated view of the total qualifying income across all uploaded bank accounts. In addition to system-generated data, you are required to manually enter certain details, such as the borrower’s name and loan number, as these fields cannot always be extracted directly from the bank statements processed by Ocrolus. This manual input ensures that all necessary loan-related information is accurately recorded for reporting and verification purposes.
Account totals table
For each uploaded bank account, the Book Summary tab presents key financial details, including:
- Expense Factor: You need to manually select an expense factor to be used for the qualifying income calculation, such as Standard, CPA/ Licensed Tax Preparer, and Profit and Loss.
- Qualifying Income: Qualifying income calculations will be shown based on the expense factor selected by the user.
- Total Deposits: The total sum of all deposits during the statement period.
- Excluded Deposits Count: The number of deposits that were excluded from income calculations.
- NSF (Non-Sufficient Funds) Days: The number of days with insufficient funds.
- Overdraft # of Days: The number of days with overdraft transactions.
- Large Deposits Count: The number of high-value deposits flagged for review.
These details allow you to quickly assess an account’s financial standing without the need for manual transaction reviews.
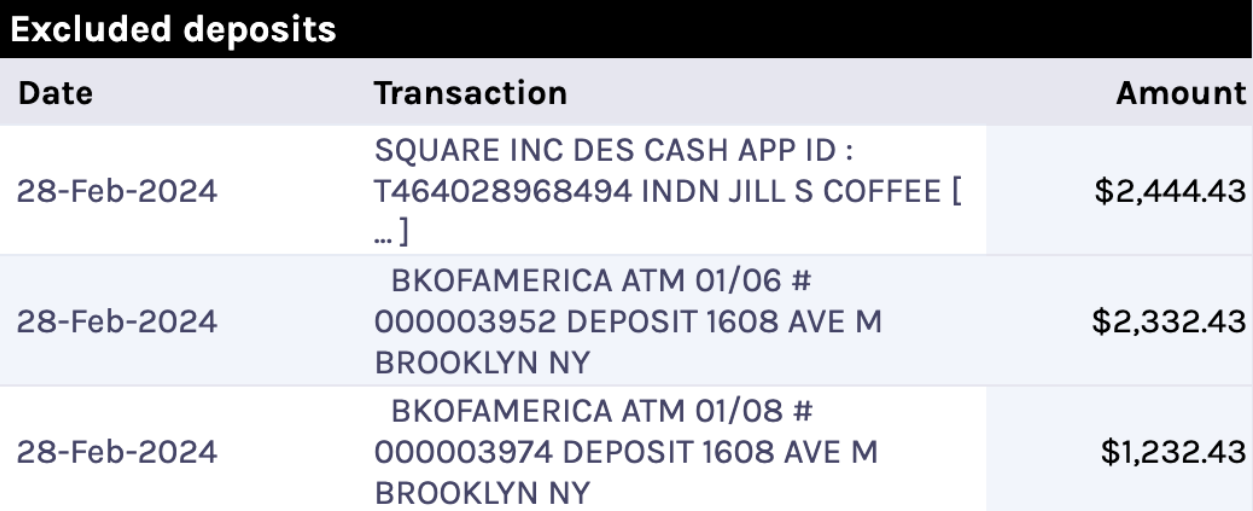
Excluded deposits table
This table provides a breakdown of deposit transactions that were not included in the income calculation. By reviewing this table, you gain insight into how income is determined and can verify exclusions.
NoteIf you manually change a deposit transaction from Included to Excluded or vice versa, the Excluded Deposits Table in the Book Summary tab will not update dynamically, as this functionality is not currently supported by Ocrolus.
Account Summary tab
The Account Summary tab provides a detailed breakdown of a bank account’s financial data to offer deeper insights beyond the high-level overview in the Book Summary tab. Review all deposit transactions, examine statement overview details, and analyze key financial patterns to better understand income trends.
This tab highlights the top 10 recurring depositors, making it easier to identify consistent income sources, and displays large deposit threshold values for each month, ensuring visibility into significant transactions. A key enhancement to the statement overview table is the Declining Income Indicator, which helps you quickly spot downward trends in income, allowing for more informed decision-making.
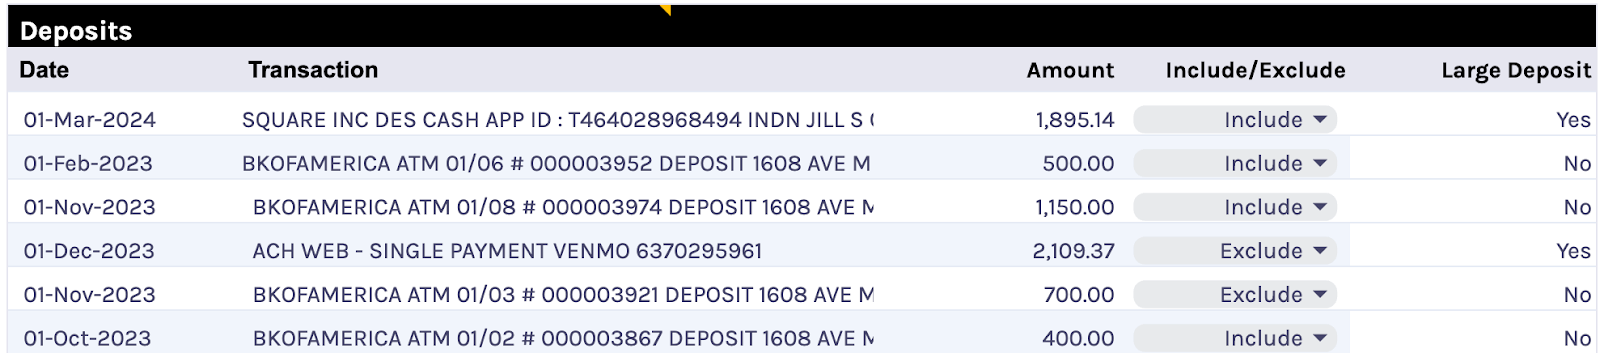
Deposits table
The Deposits Table provides a comprehensive view of all transaction-level details extracted from the uploaded bank statements. These deposit transactions are crucial in determining the qualifying income and directly impact the final computed amount.
Within this table, certain transactions may be excluded from the qualifying income calculation based on predefined criteria. The Include/Exclude field indicates whether a transaction has been considered in the income assessment, and you can manually adjust this by selecting the appropriate option from the dropdown menu.
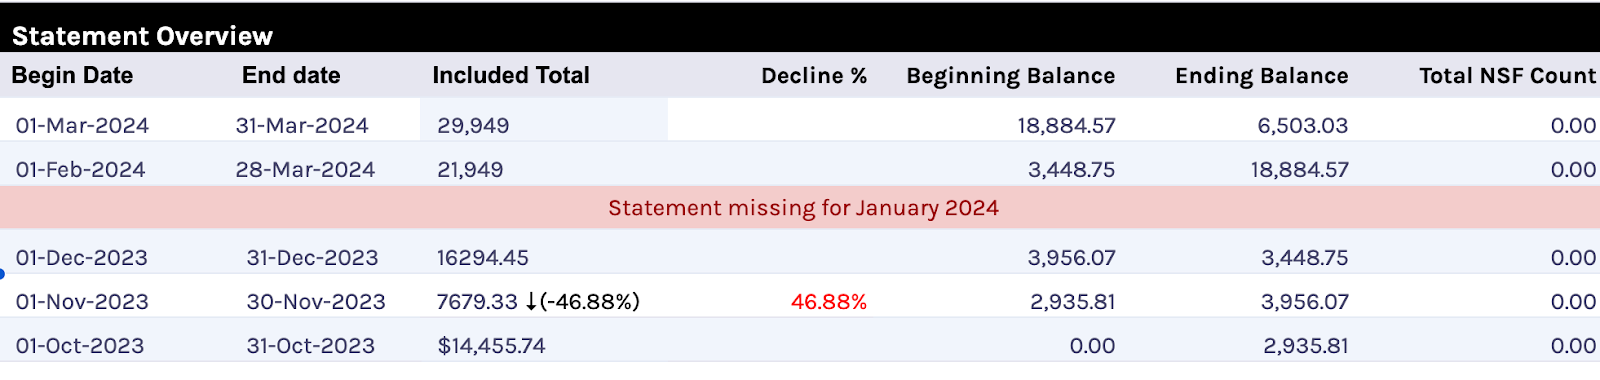
Statement Overview table
The Statement Overview table summarizes the statement periods in the uploaded bank statements. It supports up to 36 months of data within the income worksheet, providing a clear view of statement balances, total deposit amounts, and the number of NSF transactions.
This table also includes:
- A declining income indicator, which highlights periods where income trends downward, helping identify potential financial instability.
- A missing month indicator, which notifies you of any gaps in the statement period to ensure completeness in the income assessment.
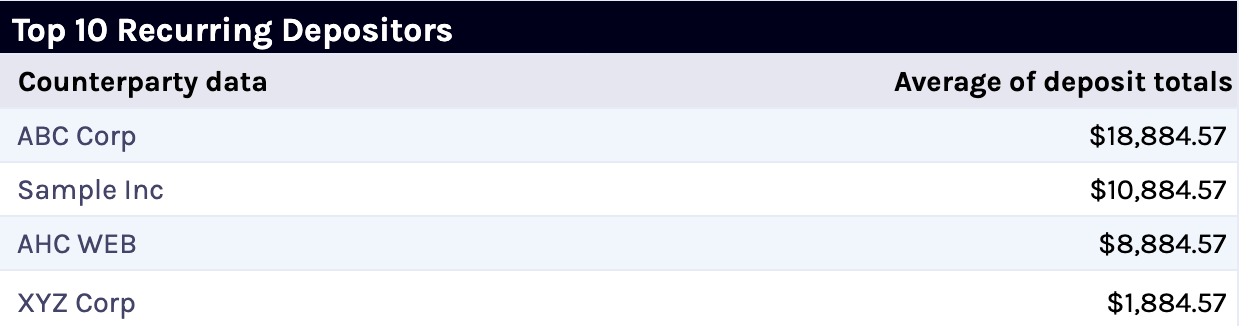
Top 10 Recurring Depositors table
The Top 10 Recurring Depositors table highlights a bank account's most frequent deposit sources. This table helps you assess the stability and reliability of income by identifying depositors who contribute regularly over time. The table displays the average deposit amount for each recurring depositor, allowing you to evaluate the significance of each income source quickly.
NSF Transaction # of days table
The NSF Transactions # Number of Days table provides a detailed month-by-month view of the number of days a bank account had NSF within the statement period. This table helps you assess a borrower’s financial management and liquidity by identifying patterns of insufficient funds at both an overall and a monthly level.
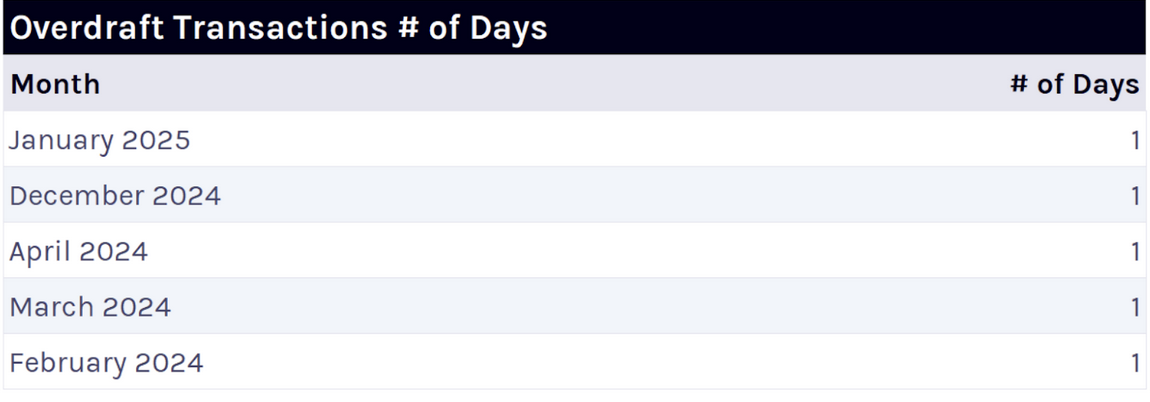
Overdraft Transaction # of days
The Overdraft Transactions # Number of Days table provides a month-by-month breakdown of the number of days a bank account had overdraft transactions within the statement period.
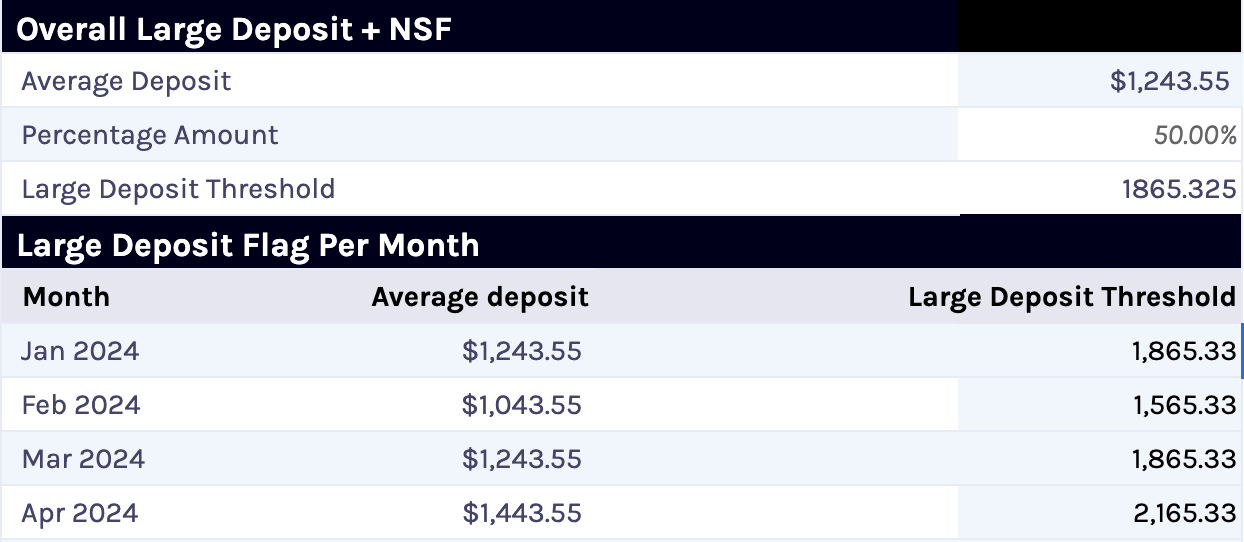
Large Deposits Threshold table
The Large Deposit Threshold table allows you to define the criteria for classifying a transaction as a large deposit. By default, a deposit is considered large if it exceeds the computed average deposit amount by at least 50%. Still, you can adjust this threshold by modifying the percentage value in the spreadsheet.
This table also provides a month-level calculation of the large deposit threshold amount, using the average deposit for each month and the user-defined percentage. Based on this threshold, transactions in the Deposits Table are marked as Yes or No under the Large Deposit column to ensure a more dynamic and accurate classification of large deposits over time.
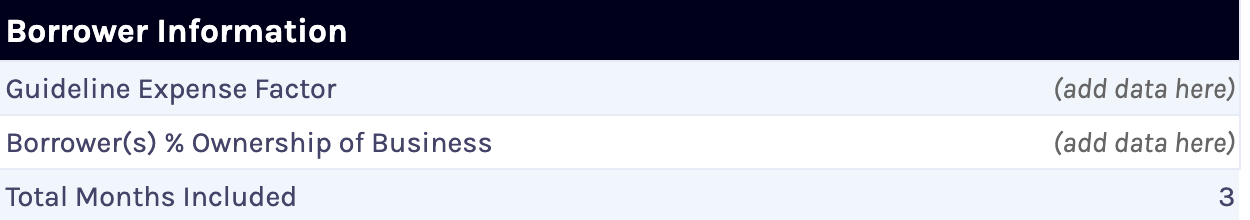
Borrower Information table
The fields in this table represent borrower-specific details used to determine the outputs within the Qualifying Income sections. You must manually enter the Guideline Expense Factor and Borrower(s) % Ownership of Business.
Qualifying income calculations
Ocrolus supports multiple methodologies for calculating qualifying income to ensure flexibility in assessing a borrower's financial position. Each method applies different criteria to determine income and allows you to select the most appropriate approach based on underwriting requirements. The available calculation methods are detailed below:
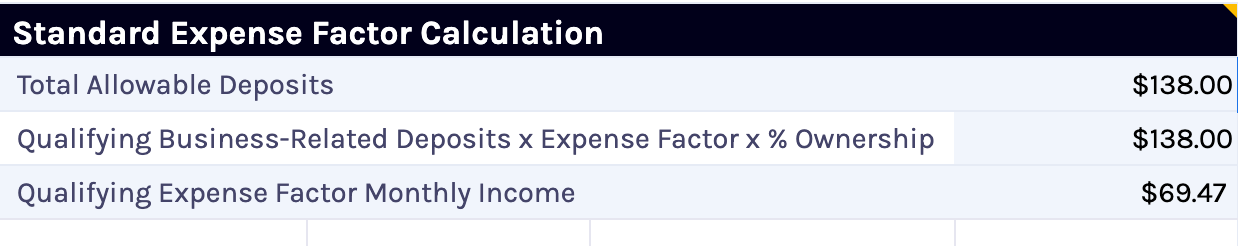
Standard expense factor calculation
The following are the available standard expense factor calculations:
- Total Allowable Deposits: The sum of all deposits from column T that are marked as Included in Column V.
- Qualifying Business-Related Deposits × Expense Factor × % Ownership: The Borrower's % of Ownership of Business multiplied by the difference of the Included Deposits minus the total of Included Deposits multiplied by the Guideline Expense Factor.
- Qualifying Expense Factor Monthly Income: Qualifying Business-Related Deposits × Expense Factor × % Ownership divided by the Total Months Included.
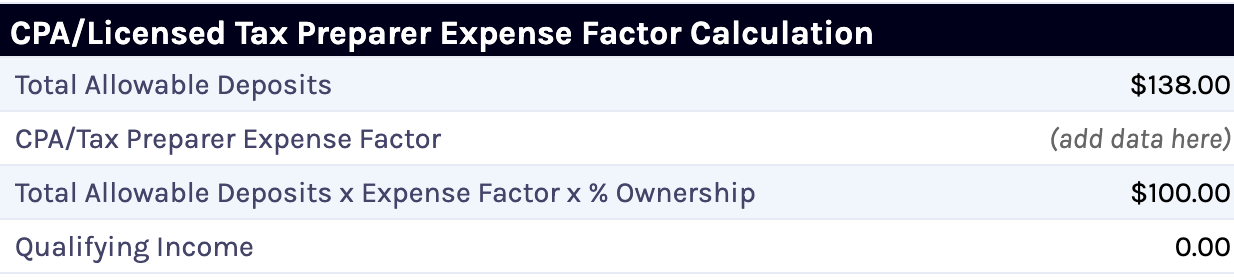
CPA Licensed tax preparer expense factor calculation
The following are the available CPA-licensed tax preparer expense factor calculations:
- Total Allowable Deposits: The sum of all deposits from column T that are marked as Included in Column V.
- CPA/Tax Preparer Expense Factor: An expense factor typically supplied by a CPA or tax preparer. It must be entered manually.
- Total Allowable Deposits × Expense Factor × % Ownership: The Borrower’s % of Ownership of Business multiplied by the difference of the Included Deposits minus the total of Included Deposits multiplied by the CPA Expense Factor.
- Qualifying Income: Qualifying Business-Related Deposits × CPA Expense Factor × % Ownership divided by the Total Months Included.
Profit & loss expense factor calculation
The following are the available profit & loss expense factor calculations:
- Gross Revenue from Profit and Loss Statement: Total gross revenue from a borrower-provided profit and loss statement. It must be entered manually.
- Expenses from Profit and Loss Statement: Total expenses from a borrower-provided profit and loss statement. It must be entered manually.
- Expense Factor (Expenses / Gross Revenue): Expenses from Profit and Loss Statement divided by Gross Revenue from Profit and Loss Statement expressed as a percentage.
- Total Allowable Deposits minus Expenses: Gross Revenue from Profit and Loss Statement minus Expenses from Profit and Loss Statement.
- Total Allowable Deposits × Expense Factor × % Ownership: Total Allowable Deposits minus Expenses multiplied by Borrower % Ownership of Business.
- Qualifying Income: Total Allowable Deposits × Expense Factor × % Ownership divided by Total Months Included.
- Tolerance of Allowable Deposits / Gross Revenue: Total Included Deposits divided by Gross Revenue from Profit and Loss Statement, expressed as a percentage.

Updated 19 days ago